


Visa: A Safe Haven in Times of Uncertainty? #VISA #V - 20/12/2022
Visa: A Safe Haven in Times of Uncertainty? #VISA #V - 20/12/2022
Gaining Insights into Visa's Future Outlook through Fundamental, Quantitative, and Technical Analysis.


Welcome, fellow investors!
In today’s article, we will take an in-depth look at Visa, the world's second-largest card payment company. We will examine the company's current position in the industry, analyze its financial fundamentals, and delve into alternative data to get a comprehensive understanding of its performance. Finally, we will also provide a technical analysis of the price action to round out our analysis. Join us as we explore all aspects of Visa and see how it stacks up in today's market.
But first things first, what is VISA and what do they do?
Visa Inc. is a global payment technology company that offers a range of credit, debit, and prepaid card products as well as tap-to-pay and tokenization services. It operates VisaNet, a transaction processing network that facilitates the authorization, clearing, and settlement of payment transactions. Visa also offers real-time payment network Visa Direct, multilateral B2B cross-border payments network Visa B2B Connect, and cross-border consumer payments business Visa Treasury as a Service. The company's Visa DPS division provides value-added services such as fraud prevention, dispute management, data analytics, and contact center services. Additionally, Visa offers payment management platform Cybersource and risk and identity solutions such as Visa Advanced Authorization and Visa Secure. The company also provides consulting and advisory services through its Visa Consulting and Analytics division. Visa serves consumers, merchants, financial institutions, and government entities and operates under the Visa, Visa Electron, Interlink, VPAY, and PLUS brands. It was founded in 1958 and is headquartered in San Francisco, California. At the time of writing this article V 0.00%↑ price is exactly 205$.
1. Industry Analysis
Visa is a payments technology company that primarily operates as a network provider for payment transactions. However, it also offers a range of B2B services, which classifies it as part of the general Business Services industry. In terms of industry analysis, the IPAY 0.00%↑ ETF, which focuses on digital and mobile payment stocks, could be used to track the performance of Visa and other companies in the industry.
There has been significant growth in digital payment transactions globally, with a compound annual growth rate of 13% between 2018 and 2021. In emerging markets, this growth has been even more pronounced, with a growth rate of 25% over the same period. Some of the fastest growth has occurred in emerging markets in Africa and Asia, and it is expected that this trend will continue in the coming years with projected compound annual growth rates of 15% between 2021 and 2026.
There are several factors driving this growth in digital payments. The pandemic has accelerated the shift from cash to contactless digital payments, which was already underway among consumers. Additionally, e-commerce has continued to grow and evolve, with global volumes increasing by 25% between 2019 and 2020 and expected to continue growing at a rate of 12-15% per year until 2025. Government efforts to promote cashless payments for interoperability, tax purposes, and aid distribution have also contributed to the uptake of new digital payment systems in some markets. Finally, increased investor interest in digital payments has led to the proliferation of payments-focused fintechs.
Despite the growth of digital payments, cash remains the dominant form of payment in some markets. In Africa, for example, cash was used in 95% of transactions in 2021. Retail agents, such as M-Pesa and MTN, help facilitate cash transactions for less digitally savvy customers through their networks of agents. In Southeast Asian markets, cash is still the top in-person point-of-sale payment method, while in Latin America, where credit and debit cards are more established, cash accounts for 36% of point-of-sale transaction value.
Let’s see some metrics
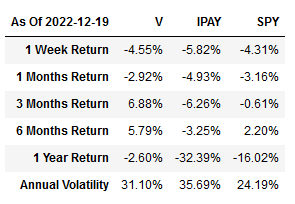
It appears that the IPAY ETF, has underperformed the overall market (as represented by the S&P 500) over the past year, with a return of -31.77% compared to -16.59% for the S&P 500. Meanwhile, Visa has performed relatively well during this bear market, with a return of -2.76% over the past year. The annual volatility for the S&P 500 was 24.22%, while it was higher for both the IPAY ETF (35.78%) and Visa (31.11%). In the shorter term, the 6 and 3-month returns for Visa have been positive, but the 1-month and 1-week returns have been negative. However, Visa has still outperformed the industry and the overall market.
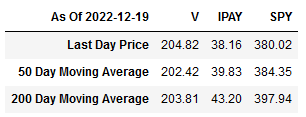
At the time of writing this article, it appears that both the IPAY ETF and the S&P 500 are below their 50-day and 200-day moving averages indicating that they are in a downtrend, while Visa is above both of its moving averages, showing a good uptrend.
Industry Breath
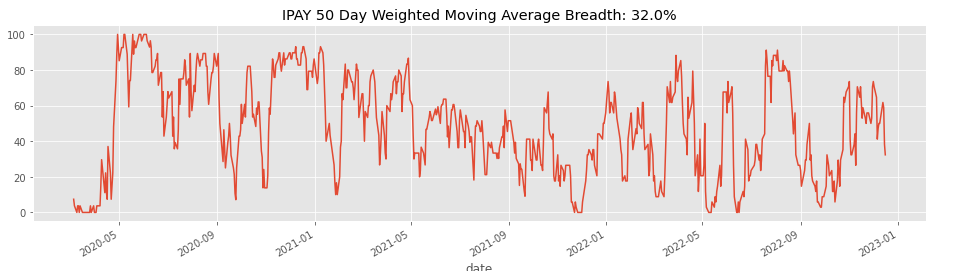
We will perform a breath indicator analysis to explore the trend of the industry. The analysis shows that 32% of the companies in the ETF are above their 50-day moving average and only 21% are above their 200-day moving average. This indicates that the industry is currently in a downtrend.

2. Fundamental Analysis
2.1 Revenue
Visa's revenue growth has fluctuated around the industry average, but it has consistently remained above zero, indicating that the company has experienced positive revenue growth over time.

To gain a better understanding of where Visa's revenue is coming from, it is helpful to examine the company's revenue structure. The following graph, taken from the company's 2022 annual report, shows the breakdown of Visa's revenue by source.
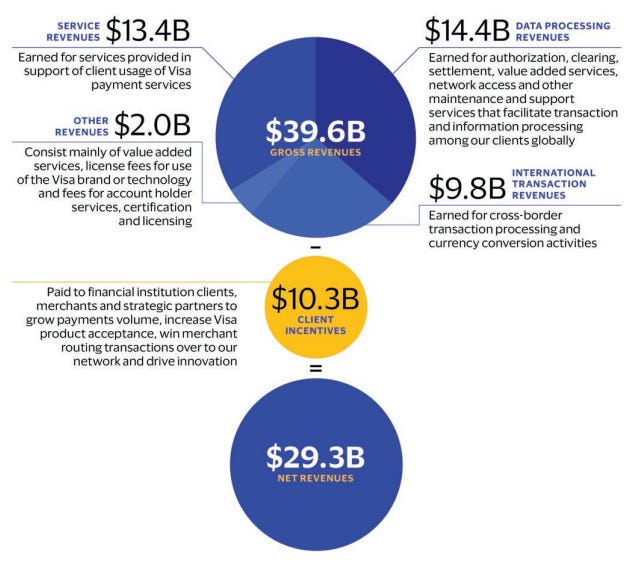
According to the graph, the main source of revenue for Visa in 2022 was data processing, which generated a net income of 14.4 billion dollars. The second largest source of revenue was services revenues, which brought in 13.4 billion dollars. International transactions contributed 9.8 billion dollars, while other sources contributed 2.0 billion dollars.
2.2 Costs
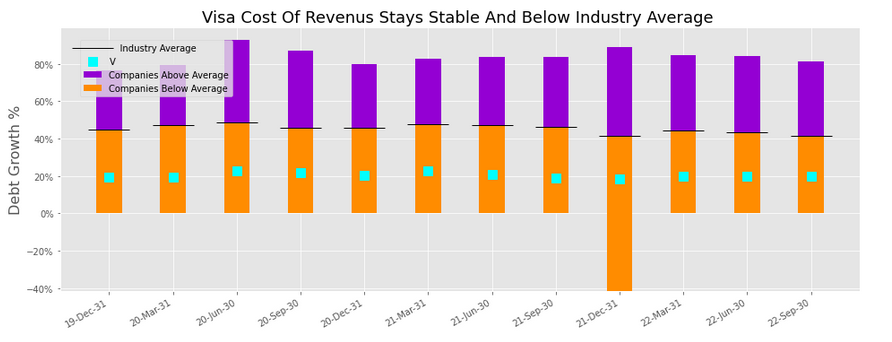
The cost of revenue is stable and is not fluctuating significantly over time, which can help the company to maintain a consistent level of profitability.
The cost of revenue is below the industry average, which suggests that the company is able to produce and sell its products or services at a lower cost than its competitors, which can be a significant advantage in a competitive market.
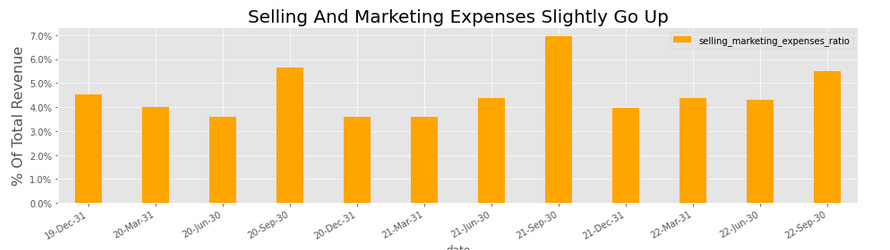
The Selling and Marketing expenses show seasonality and steadily rise to a peak in the summer. However, in the current year, the third quarter has lower expenses than the same quarter in the previous year. In the last reported quarter, the Selling and Marketing expenses were around 5.5% of total revenue.
Interest payments displayed slight increases in the most recent quarter, but overall remain stable and average approximately 2% of total revenue.

2.3 Debt
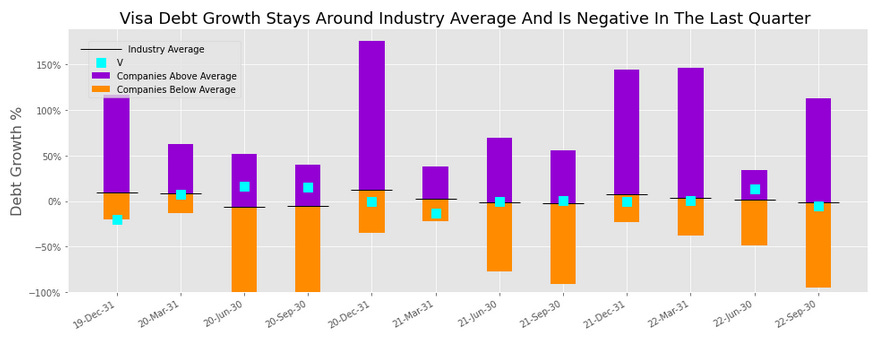
Visa's debt growth has been negative in the last quarter and generally aligns with industry averages, indicating a relatively low reliance on debt to finance operations.
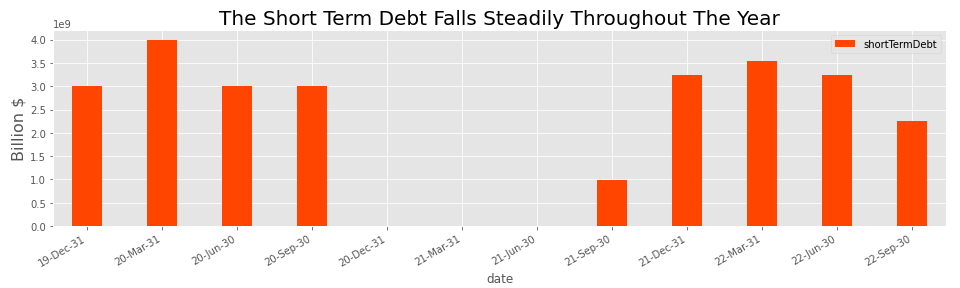
Short-term debt has steadily decreased over the course of the year, demonstrating strong financial discipline and minimal reliance on debt for daily operations. This may also be influenced by the yield curve inversion, as short-term bonds with a 1-2 year maturity currently have higher interest rates than longer-term bonds with a 10-20 year maturity.
The company's debt-to-equity ratio is below 1, averaging around 0.45, indicating a low level of financial risk and a favorable risk profile. This is particularly noteworthy given the current macroeconomic environment and rising interest rates.

Overall, Visa effectively manages its debt and does not expose itself to excessive risk, indicating solvency.
2.4 Profitability Ratios
The slowdown in free cash flow growth during the most recent quarter has not resulted in a negative trend, and the company's continued positive free cash flow may provide opportunities for increased dividends, debt repayment, or investment in growth initiatives.

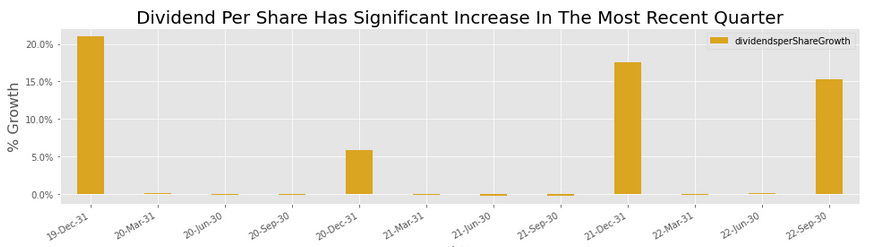
2.5 Dividends
As of December 09, 2022, Visa (V) has a trailing twelve month dividend payout of $1.80 and a dividend yield of 0.86%. Additionally, the dividend per share has experienced notable growth in the most recent quarter, indicating the company's commitment to returning value to its shareholders.
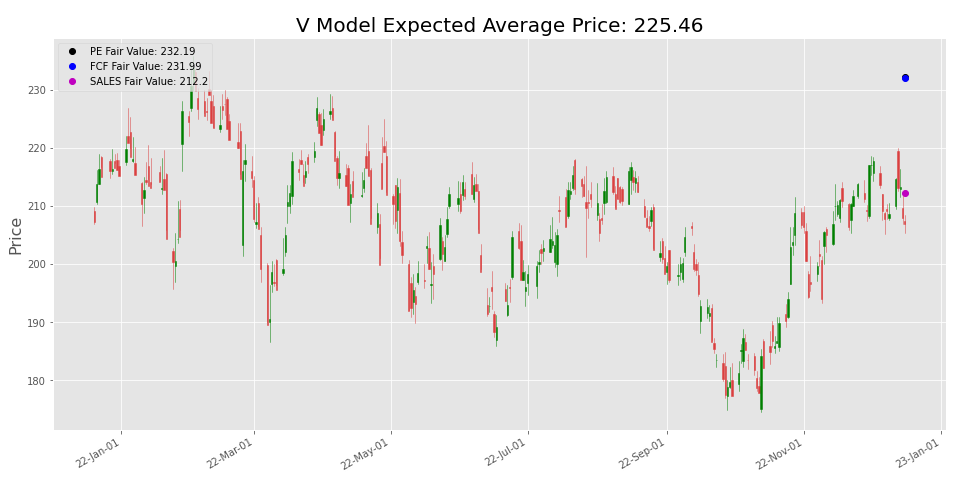
2.6 Valuation Models
According to the three Fair Value models based on price-to-earnings ratio, free cash flow, and sales, Visa is currently undervalued with an average price of $225. The price-to-earnings model indicates a valuation of $232 per share, the free cash flow model suggests a valuation of $231 per share, and the sales model estimates a value of $212 per share. Overall, all three models suggest that Visa is currently at 205$ is trading below its fair value.
3. Quantitative Analysis
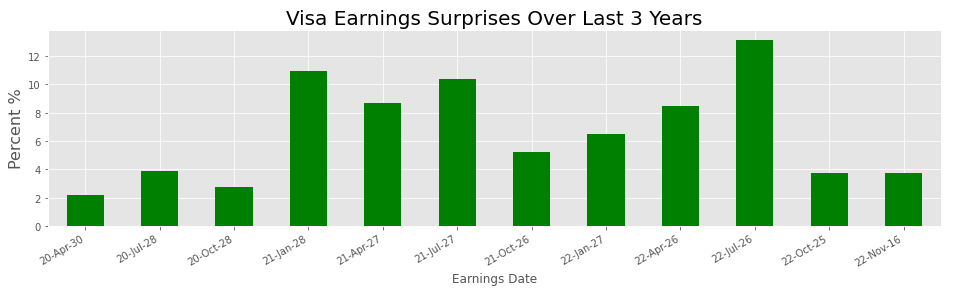
3.1 Earnings Surprises
Visa has consistently exceeded earnings estimates over the past three years, with an average surprise of 5-6% to the upside. The company's most recent earnings report revealed a 4% positive surprise, demonstrating the company's track record of consistently outperforming expectations
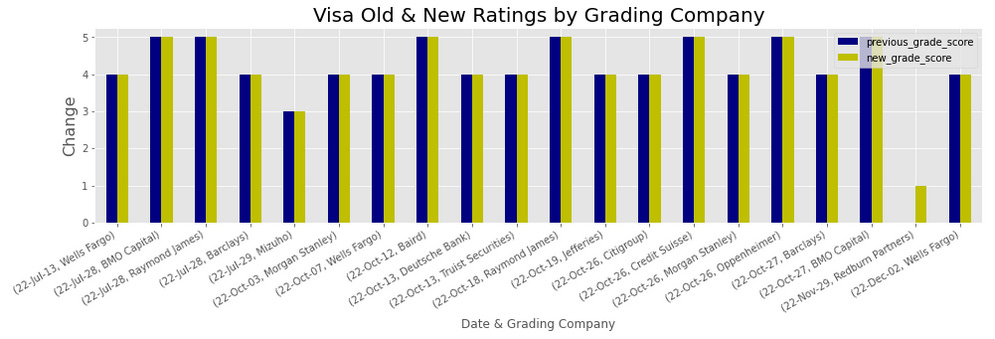
3.2 Analysts Ratings
The following graph illustrates the rating system used. A rating of 1 represents a "Sell," "Negative," or "Underperform" recommendation, while a rating of 5 indicates a "Strong Buy," "Outperform," or "Market Outperform" recommendation. As shown, the majority of analysts have given Visa a "Buy" rating, with some assigning a "Strong Buy" rating. Notably, the previous and current grades have remained consistent, indicating a positive outlook among major analysts.
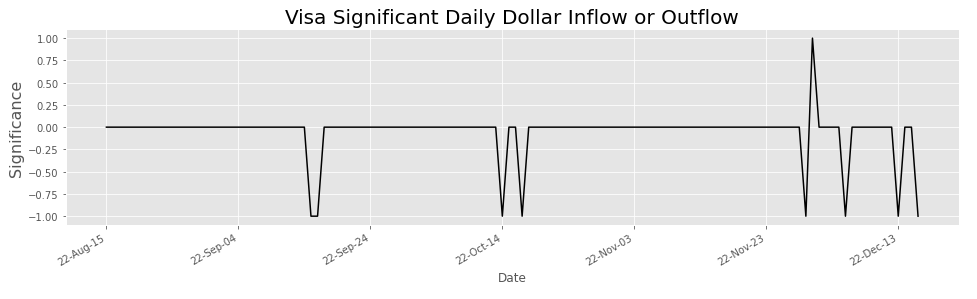
3.3 Dollar Flow
According to our dollar flow model, we observed three significant instances of money leaving the stock as a percentage of its total market capitalization in December. These outflows could be due to various factors, but they suggest that investors have been taking profits or moving their money out of the stock.
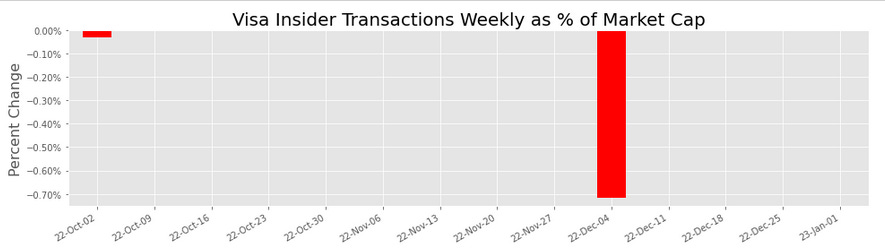
3.4 Insider Trading
Insider trading activity has been relatively quiet recently, with the only notable transactions occurring in the week ending December 4th. During this time, insiders made significant sales, which constitute 0.7% of the company's total market capitalization. There have been no further insider trades since then.
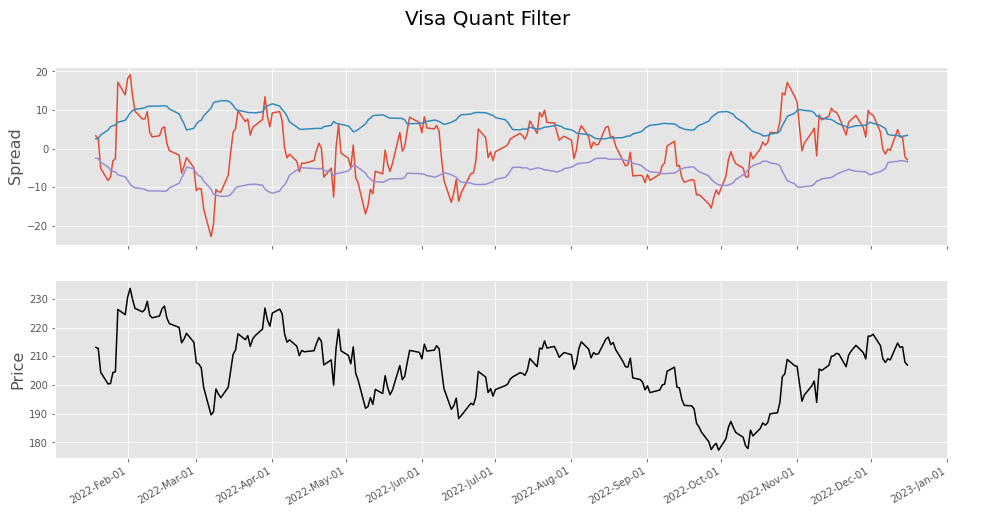
3.5 Quant Filter
We use a proprietary quant filter to evaluate whether a stock may be overbought or oversold. The filter, represented by a red line on a chart, is currently approaching the lower band and may potentially bounce back up, which could be seen as a potential buying signal.
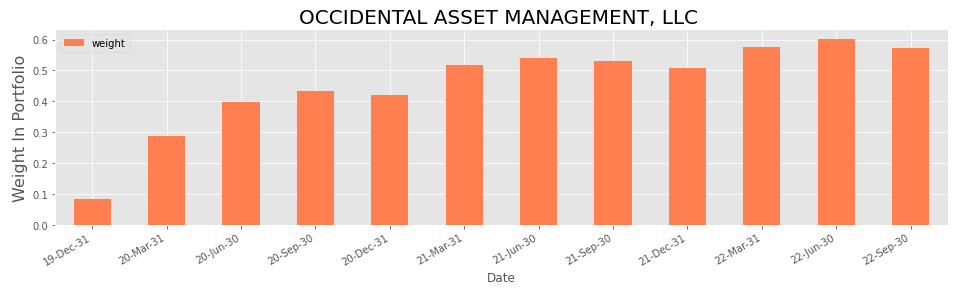
3.6 Institutional Investors
We will examine the weight of Visa in the portfolios of three major players: Renaissance Technologies, Berkshire Hathaway, and Occidental Asset Management. We will track the evolution of Visa's weight in their portfolios and its current status as of the last reporting period.
Renaissance Technologies significantly increased its stake in Visa during the summer, bringing it to nearly 0.4% of the company's portfolio. This represents a quarter-to-quarter increase of 313%, which could be interpreted as a potential buy signal.

Berkshire Hathaway has steadily reduced its stake in Visa over the past two years, with the weight of Visa in the company's portfolio decreasing from around 1% to its current level of 0.5%. In the last quarter, Berkshire Hathaway disposed of 8.5% of its stake in Visa.

Occidental Asset Management has maintained a consistent level of ownership of Visa, with the weight of Visa in its portfolio averaging around 0.5%. However, there was a slight decrease in the company's holding of Visa in the last reported quarter, as Occidental Asset Management sold 5.2% of its stake.
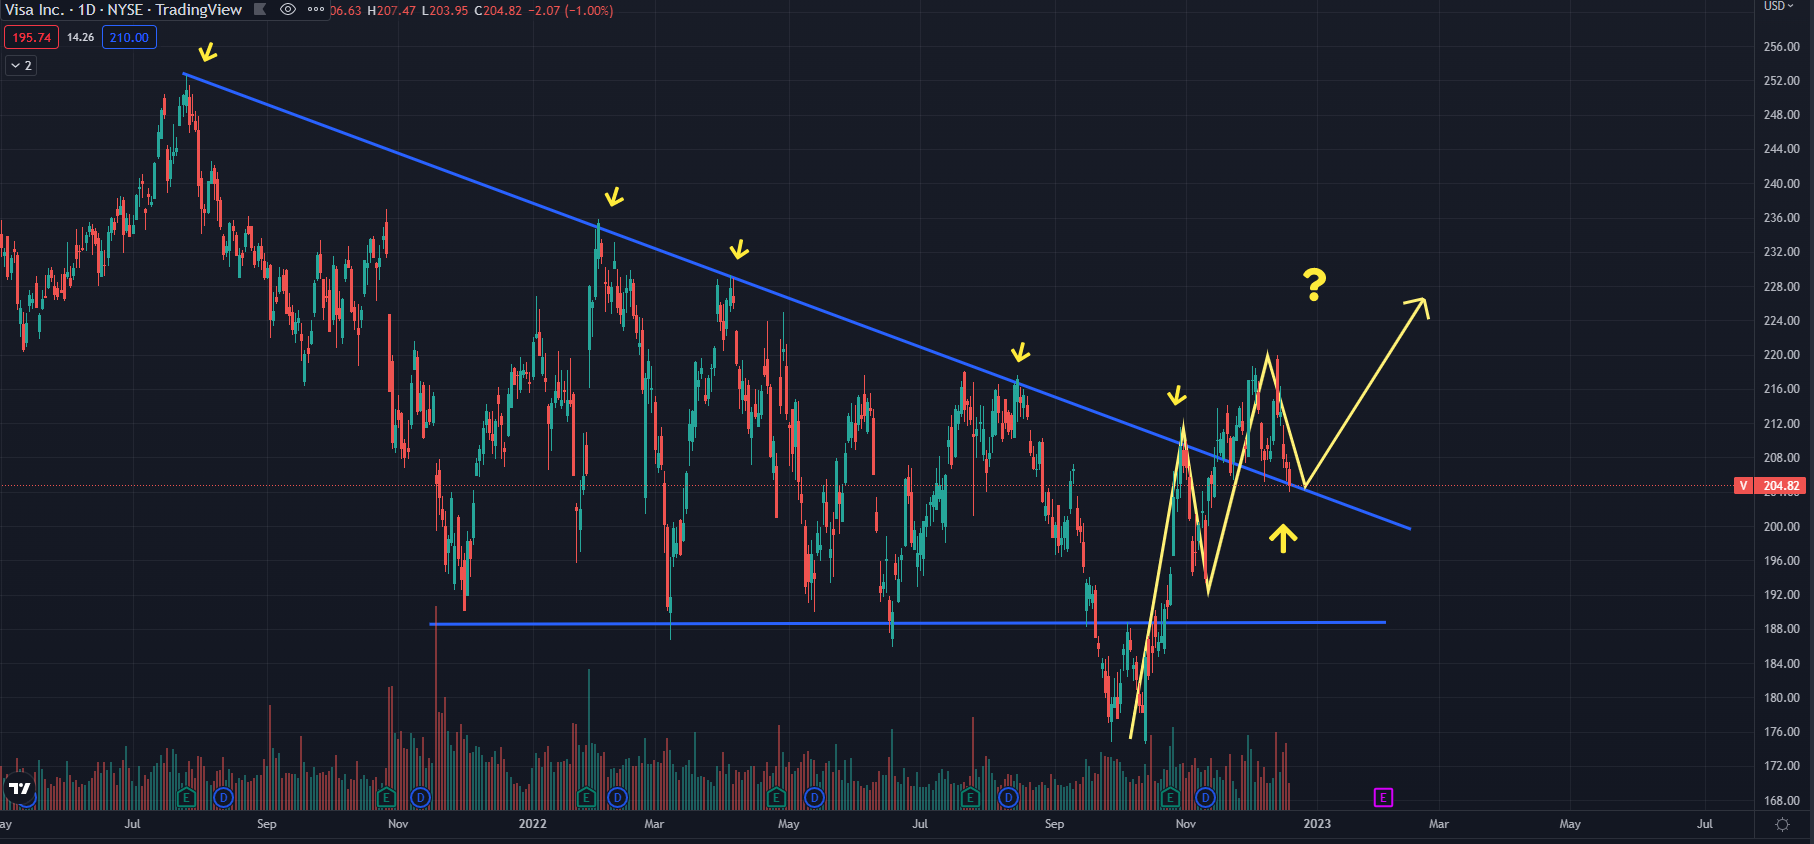
4. Price Action and Technical Analysis
At the time of writing, the current price of Visa shares is $205, with the stock experiencing a fifth consecutive day of losses. In late September, the price broke through a key support level and remained below the $190 mark for almost a month. However, the stock made a double bottom and reversed through this level in late October, leading to an uptrend. The price then tested a resistance level, retraced, and broke through it in mid-November, creating a new high. It is currently testing the former resistance level, now acting as support. It is important to closely monitor the price action in the coming days. If it bounces off the support, it may continue its uptrend and potentially create another higher high. If it breaks through the support, a retest of the previous swing low and search for a new support level may occur.
5. Conclusion
In conclusion, Visa has experienced consistent revenue growth and has a stable cost structure, which has helped it maintain a consistent level of profitability. The company effectively manages its debt and has a low debt-to-equity ratio, indicating a low level of financial risk. Additionally, Visa has consistently exceeded earnings estimates and has a strong track record of outperforming expectations. According to valuation models based on price-to-earnings, free cash flow, and sales, Visa is currently undervalued with an average price of $225, suggesting that it is trading below its fair value. Furthermore, analysts generally have a positive view of the company, with a majority rating it as a "buy" or "strong buy." Overall, the analysis suggests that Visa is a financially sound company with strong potential for future growth.
And what do you think about Visa?
Please share your thoughts in the comment section below. We would love to hear your opinion and analysis.
Disclaimer: Please note that the information provided in this article is for general informational purposes only and does not constitute financial, legal, or professional advice. The information provided should not be relied upon as a substitute for financial, legal, or professional advice. Before making any decision, it is important to consider all relevant information and consult with a professional who can provide personalized advice based on your specific circumstances. The author and publisher of this article cannot be held liable for any actions taken based on the information provided. This is not a recommendation to buy or sell any specific securities or financial instruments.