


The Fibonacci Song
The Fibonacci Song
23.6%, 38.2%, 61.8%, and 78.6% (oh how it rhymes)

Hello and welcome to another issue of 🕵 The Seeker 🕵
“Higher, Faster, Stronger - Together.” - Official Olympics Motto
1) Big moves drawing attention from the last three trading days
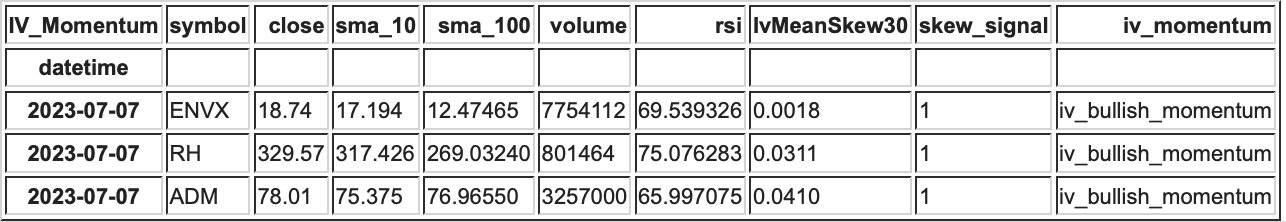
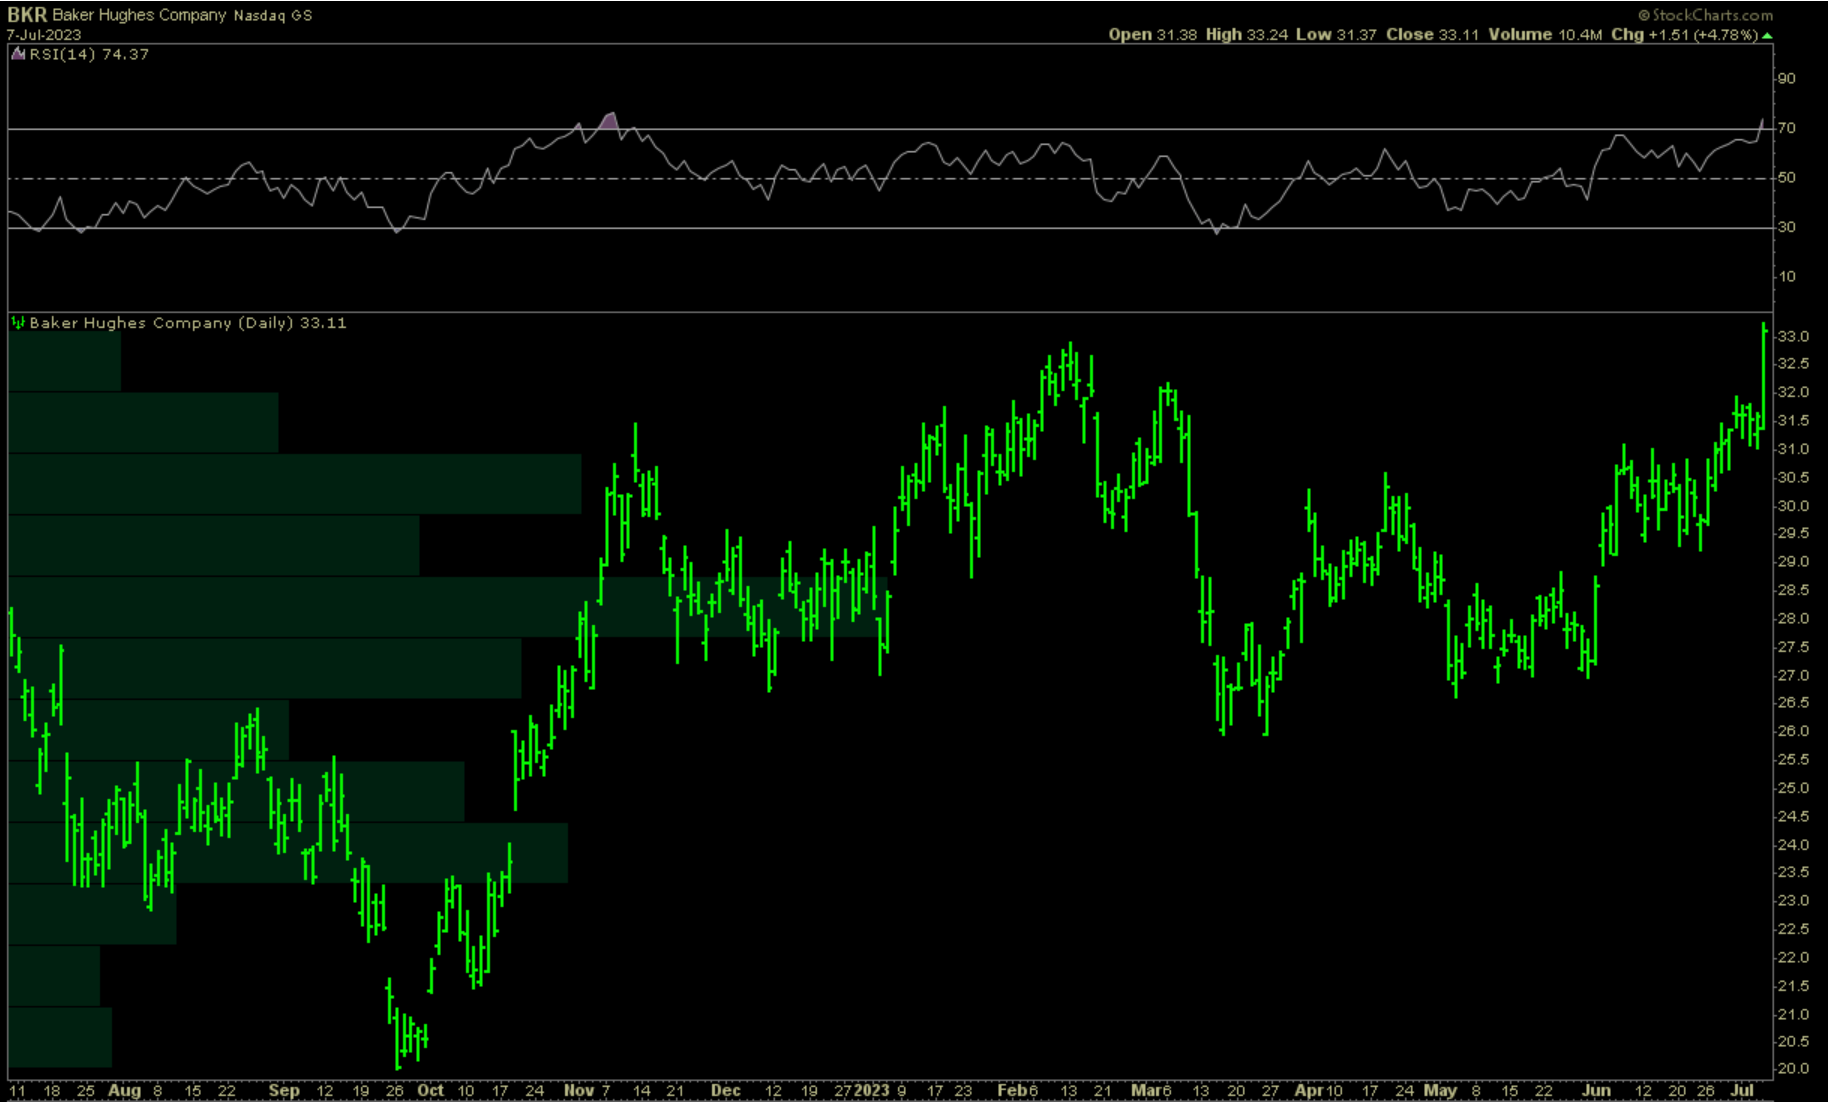
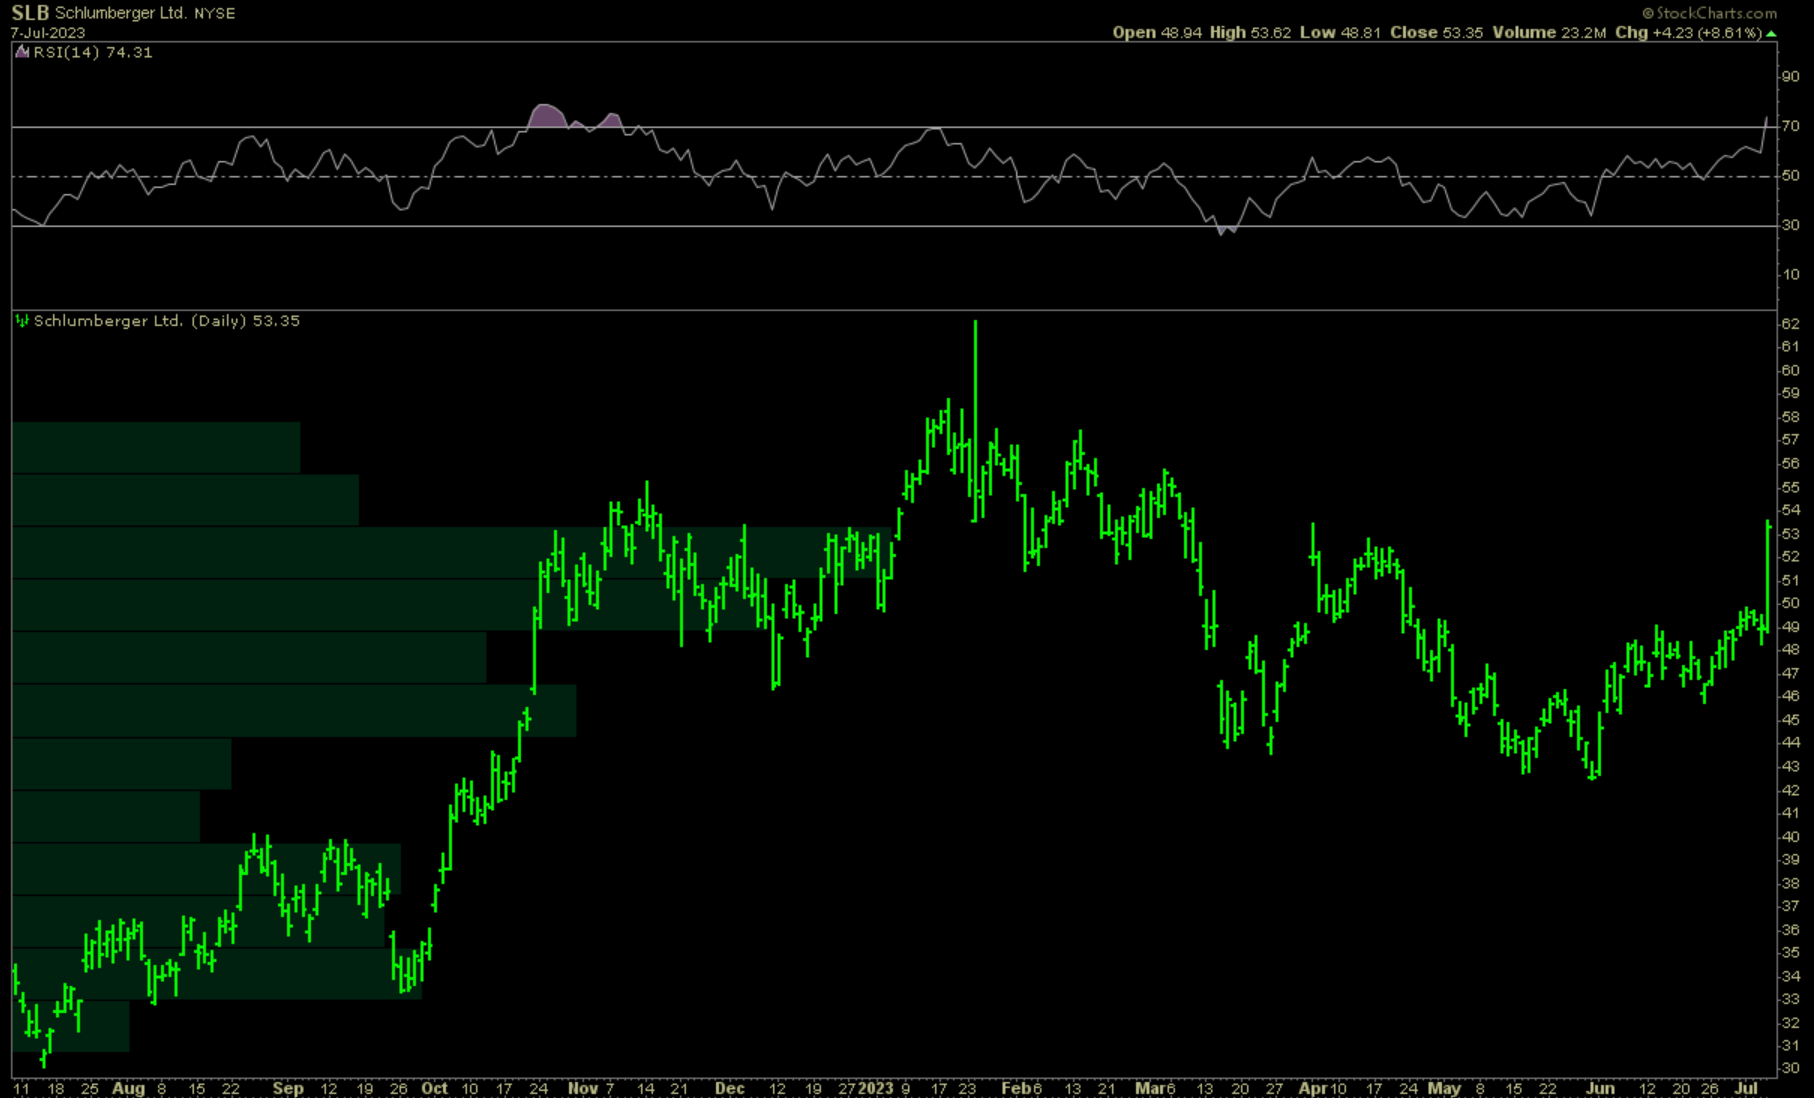
Gaining investor’s attention Friday were oil services appearing to breakout and closing at the top of their daily range on heavy buying volume. Since they are pretty much the same chart, we’re watching the outlooks for both BKR 0.00%↑ and SLB 0.00%↑ below.
In the automobile manufacturers space, this week we saw huge call buying and a spike in RIVN 0.00%↑. This continues further strength in the sector, as well as for IPOs, whose own etf this year nearly perfectly mirrors the gains for the large cap dominated Nasdaq100.
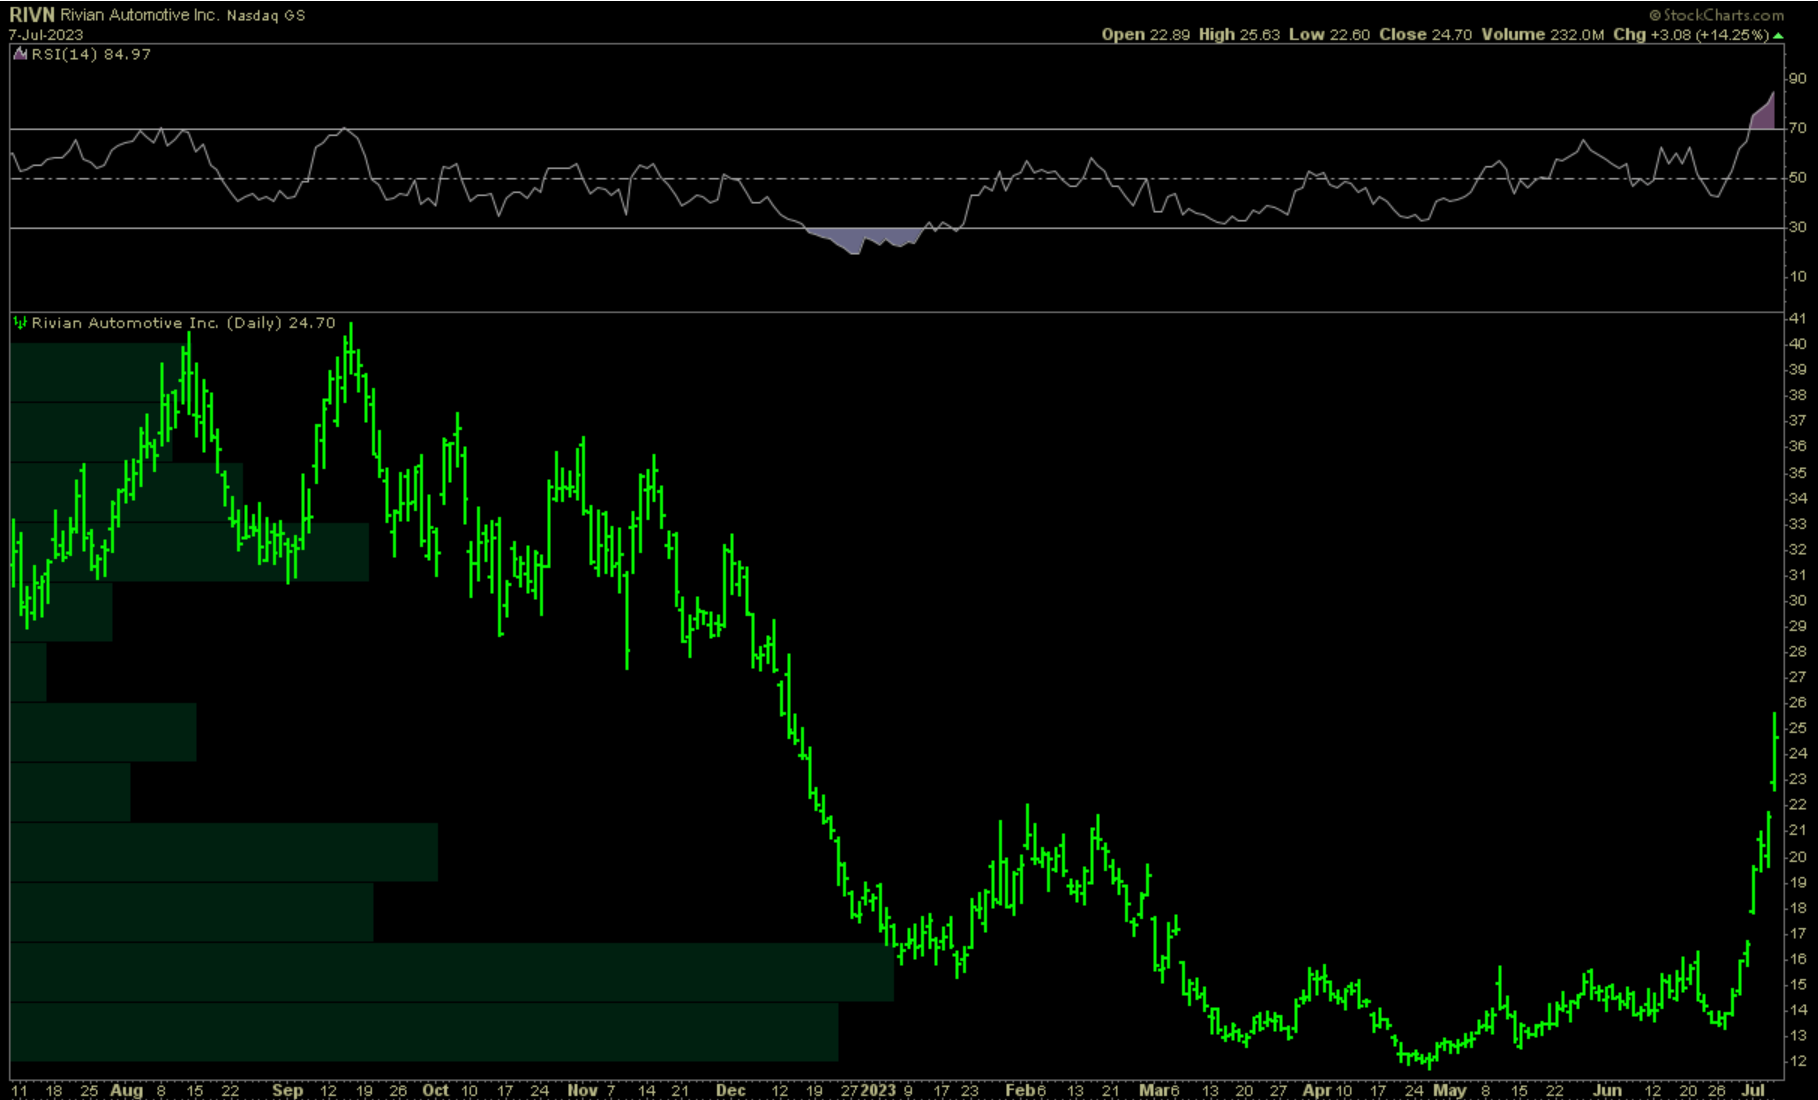
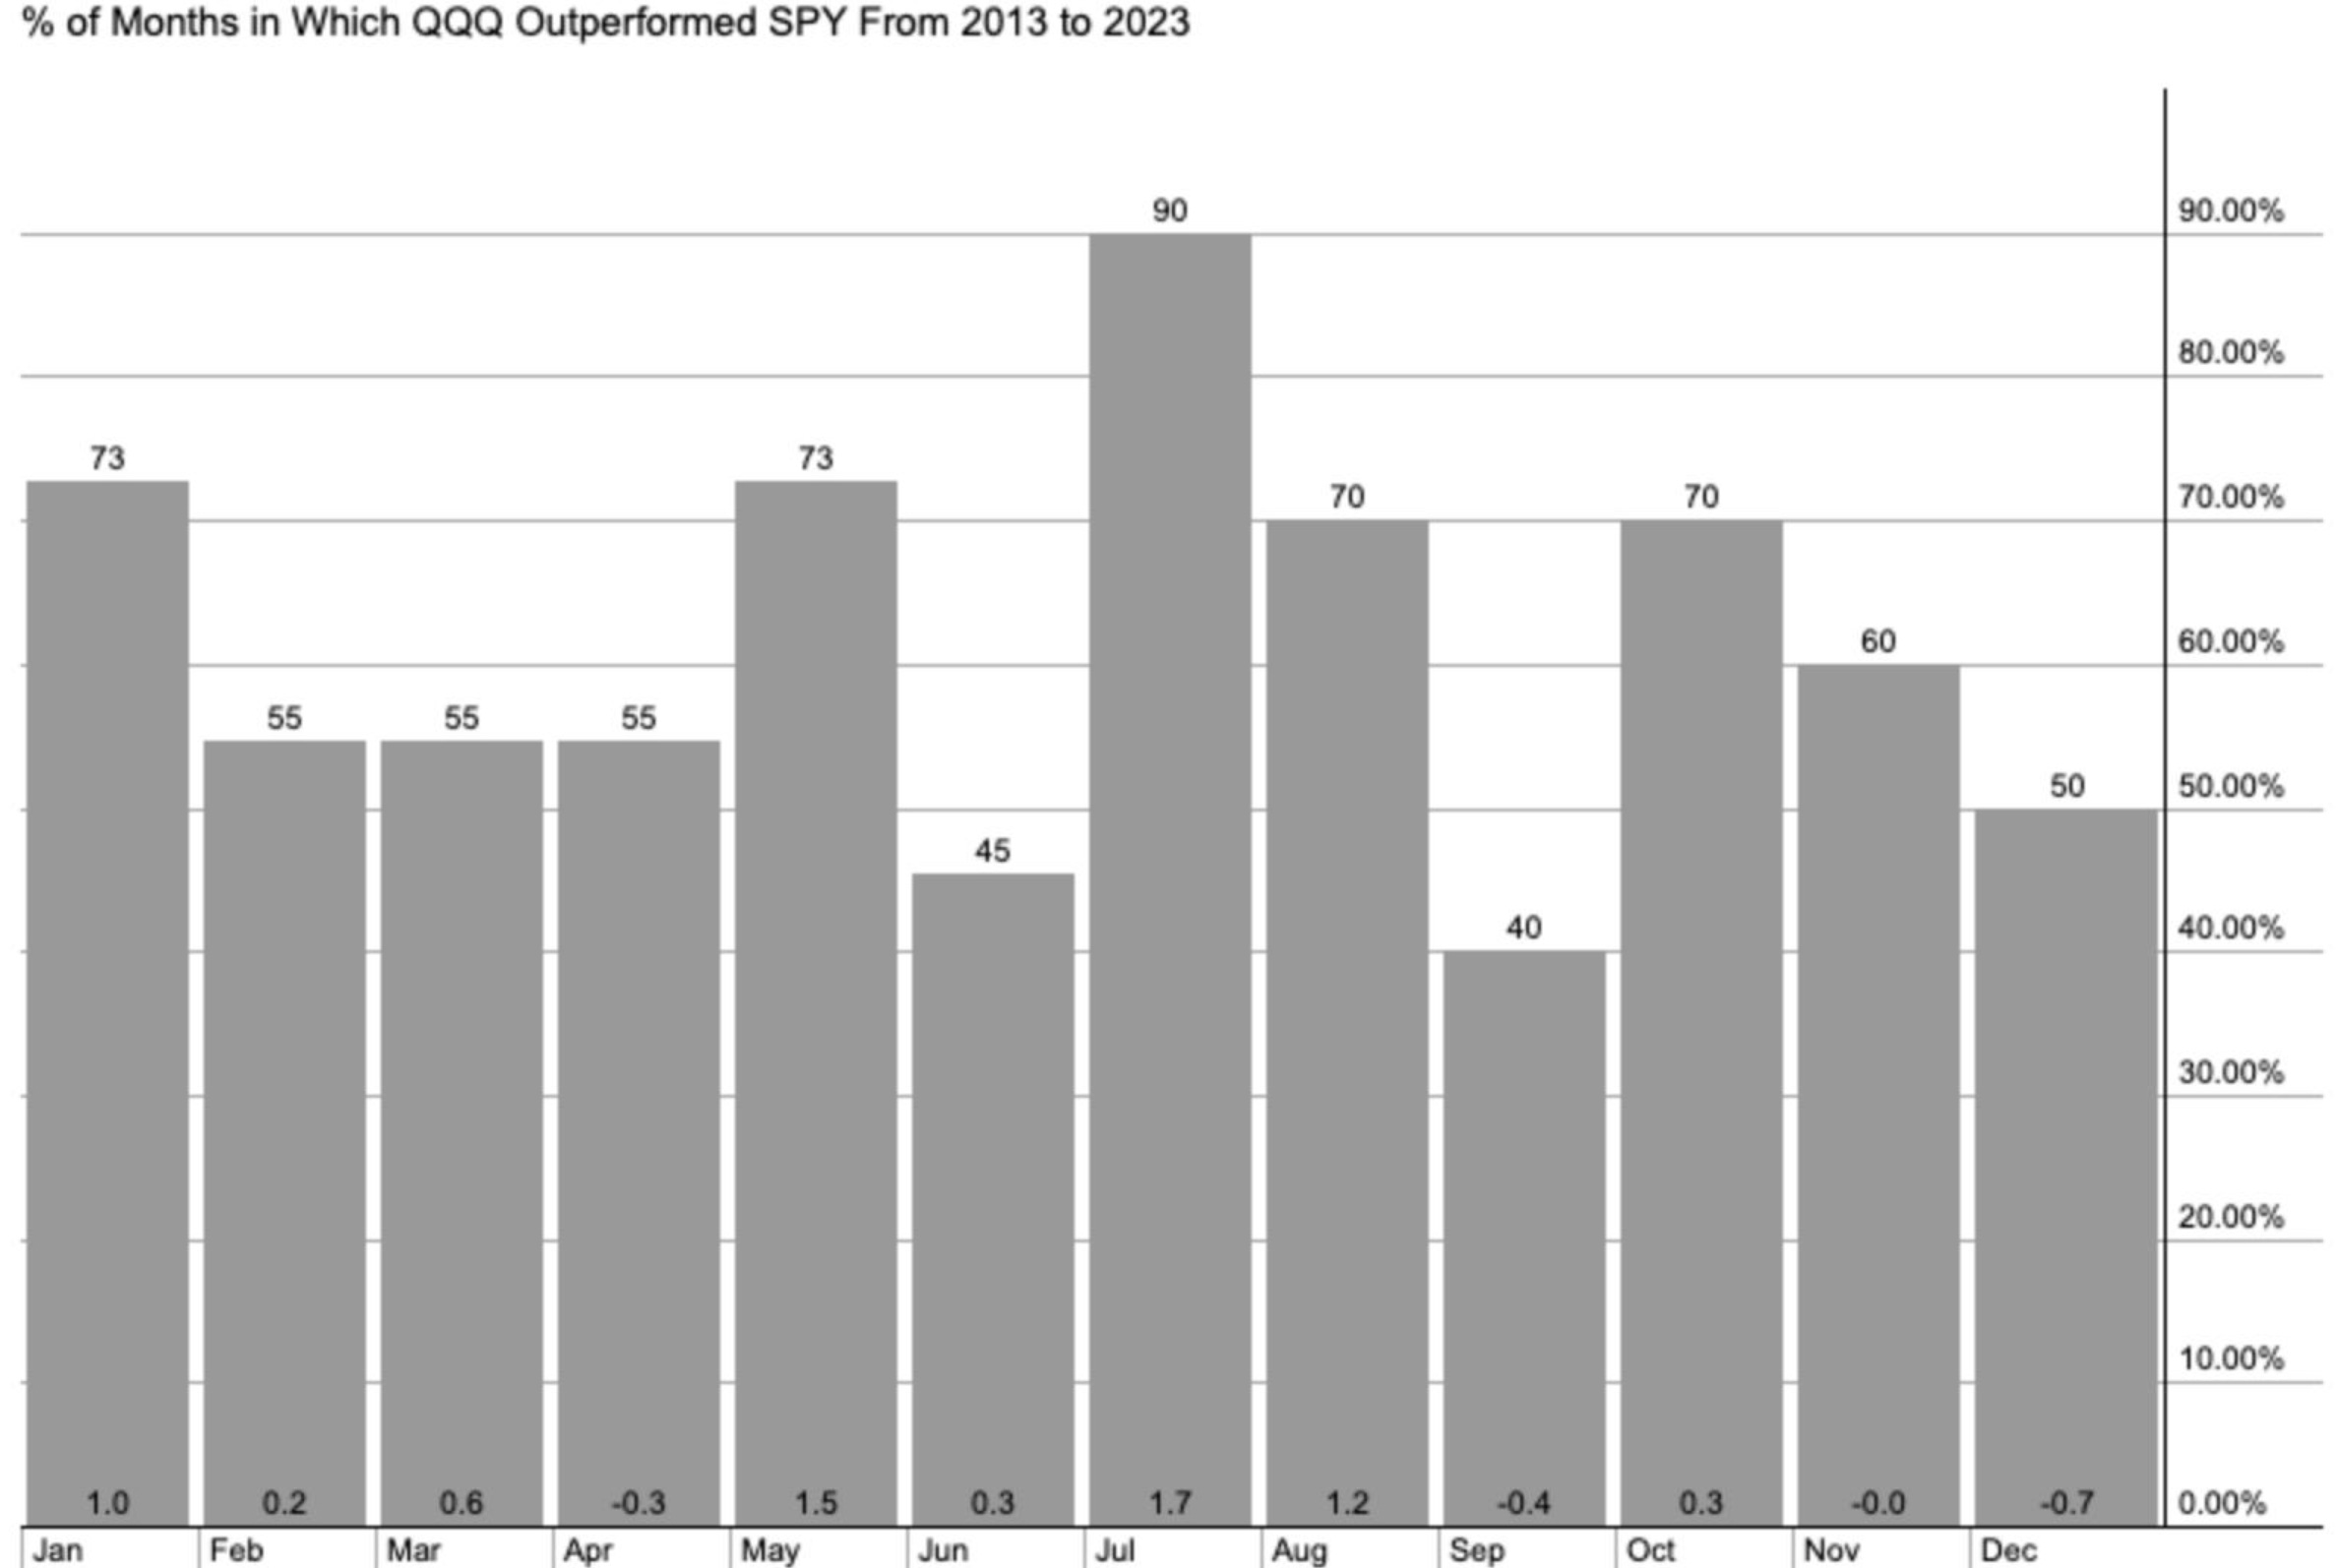
Chasing breakout stocks is oftentimes a very difficult game to keep profitable unless one has a well defined trading plan for these types of moves. Another option is using the traders almanac and seeing where there is a likelihood of getting in front of normal inter market rotation. By having a look at seasonality, this can give us a clue.
Checking out normal behavior for July & August, we see that technology stocks usually have their best period in relation with the rest of the market.
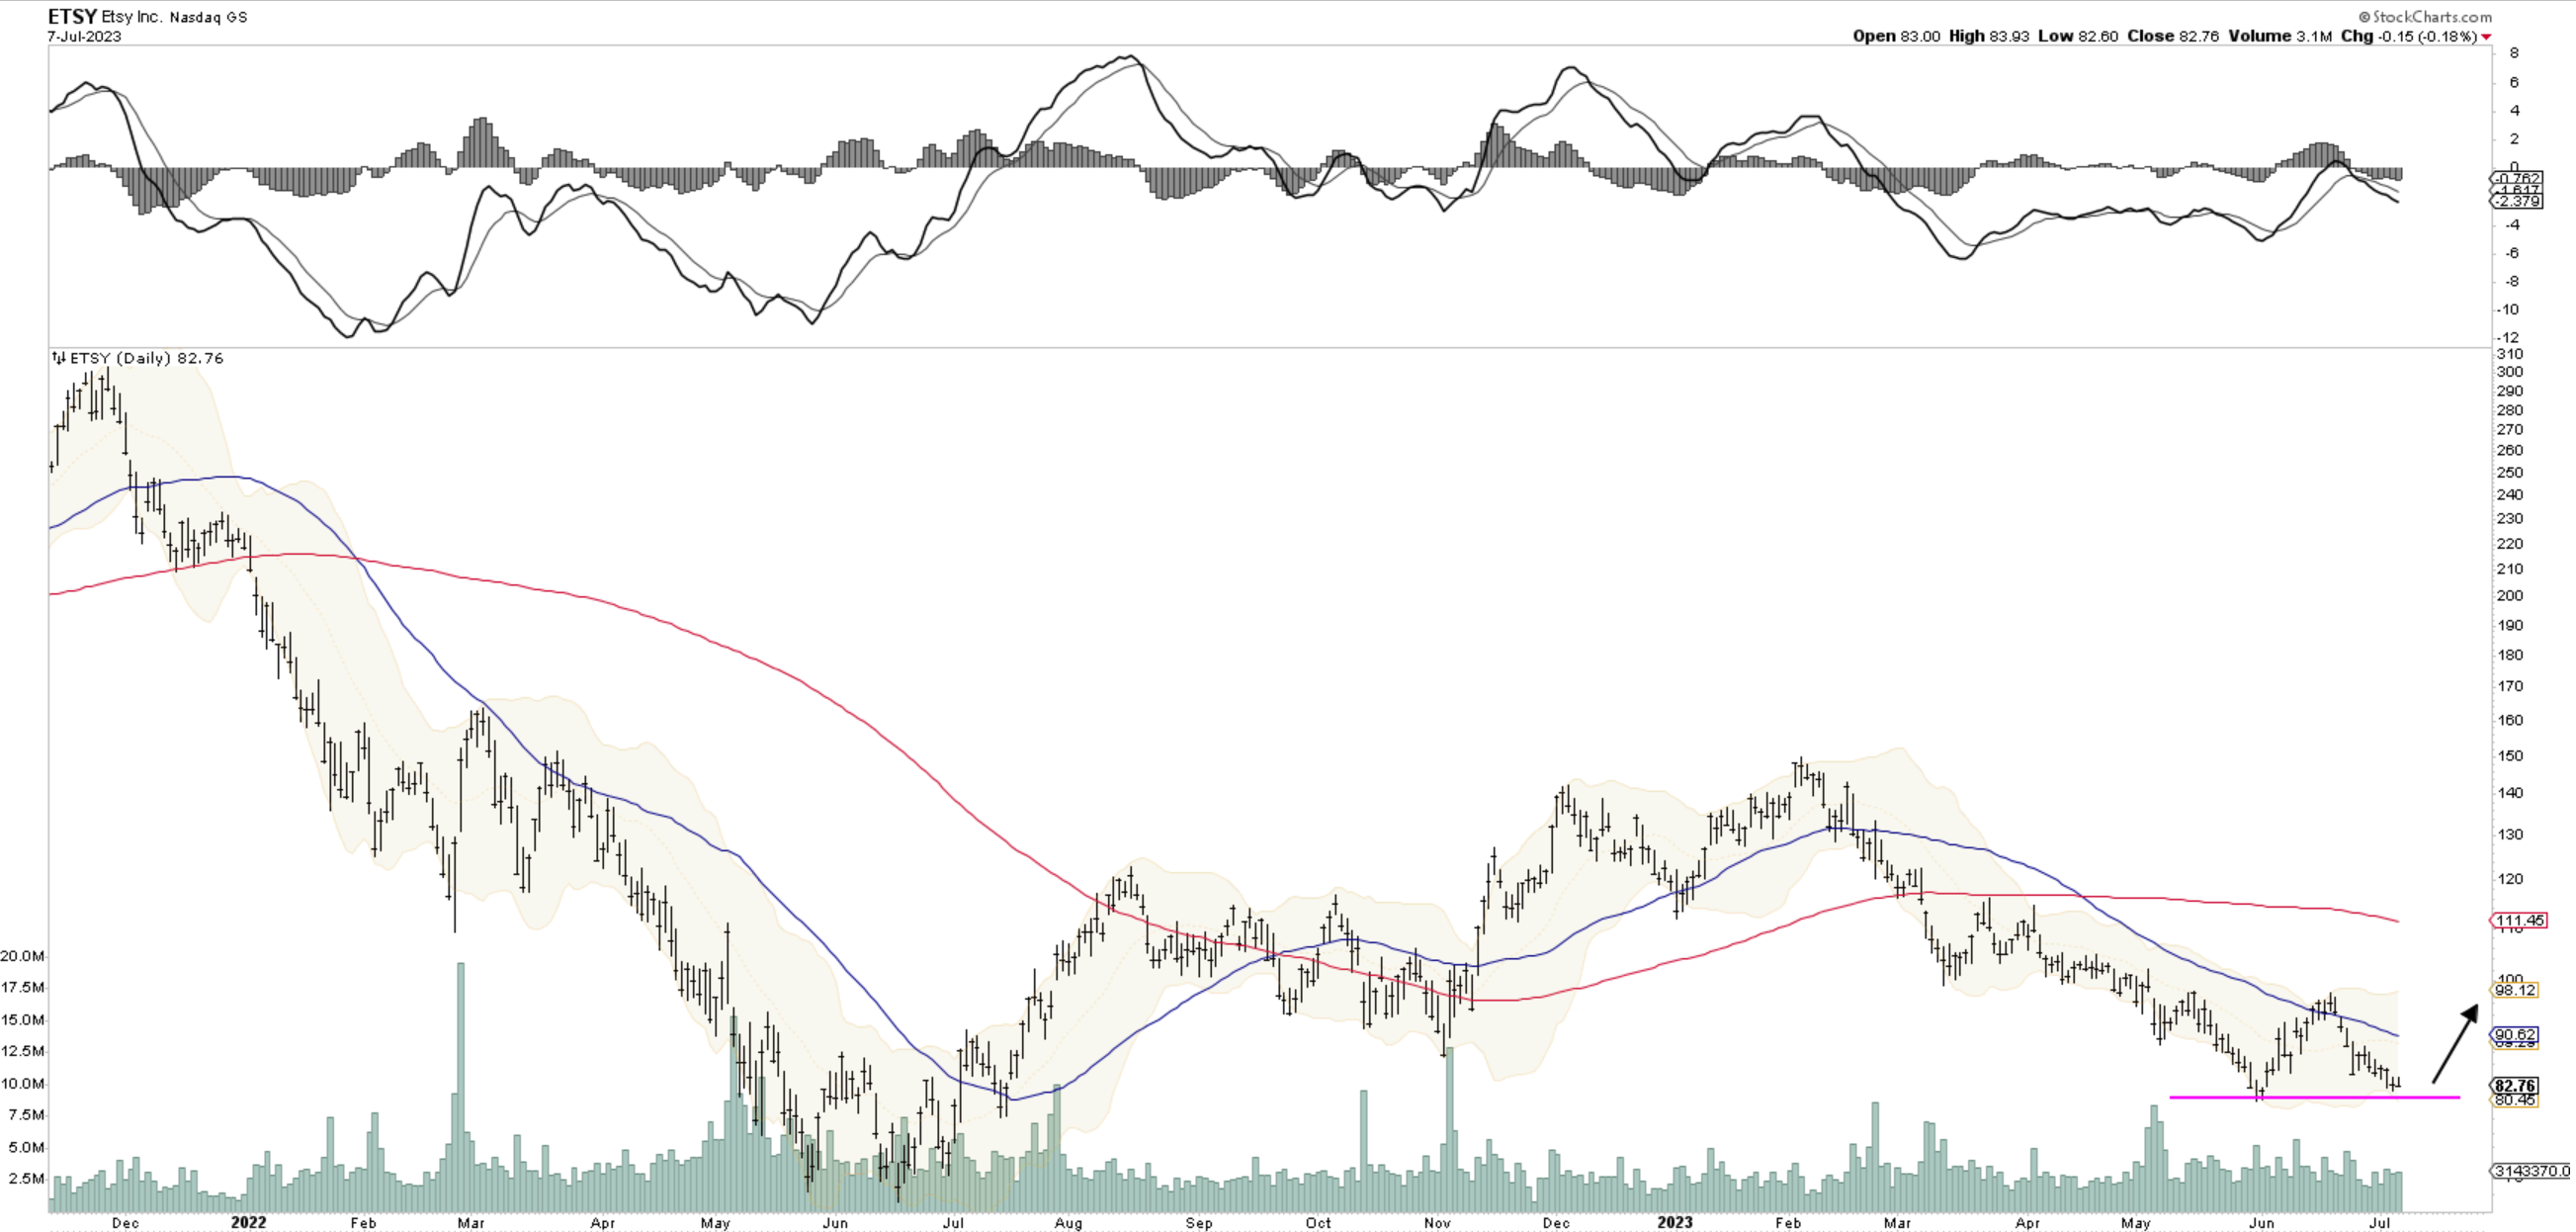
For this reason, we might be able to catch a reversal in a name like ETSY 0.00%↑ who may also benefit by early holiday retail momentum (stop levels easily recognizable on chart below).
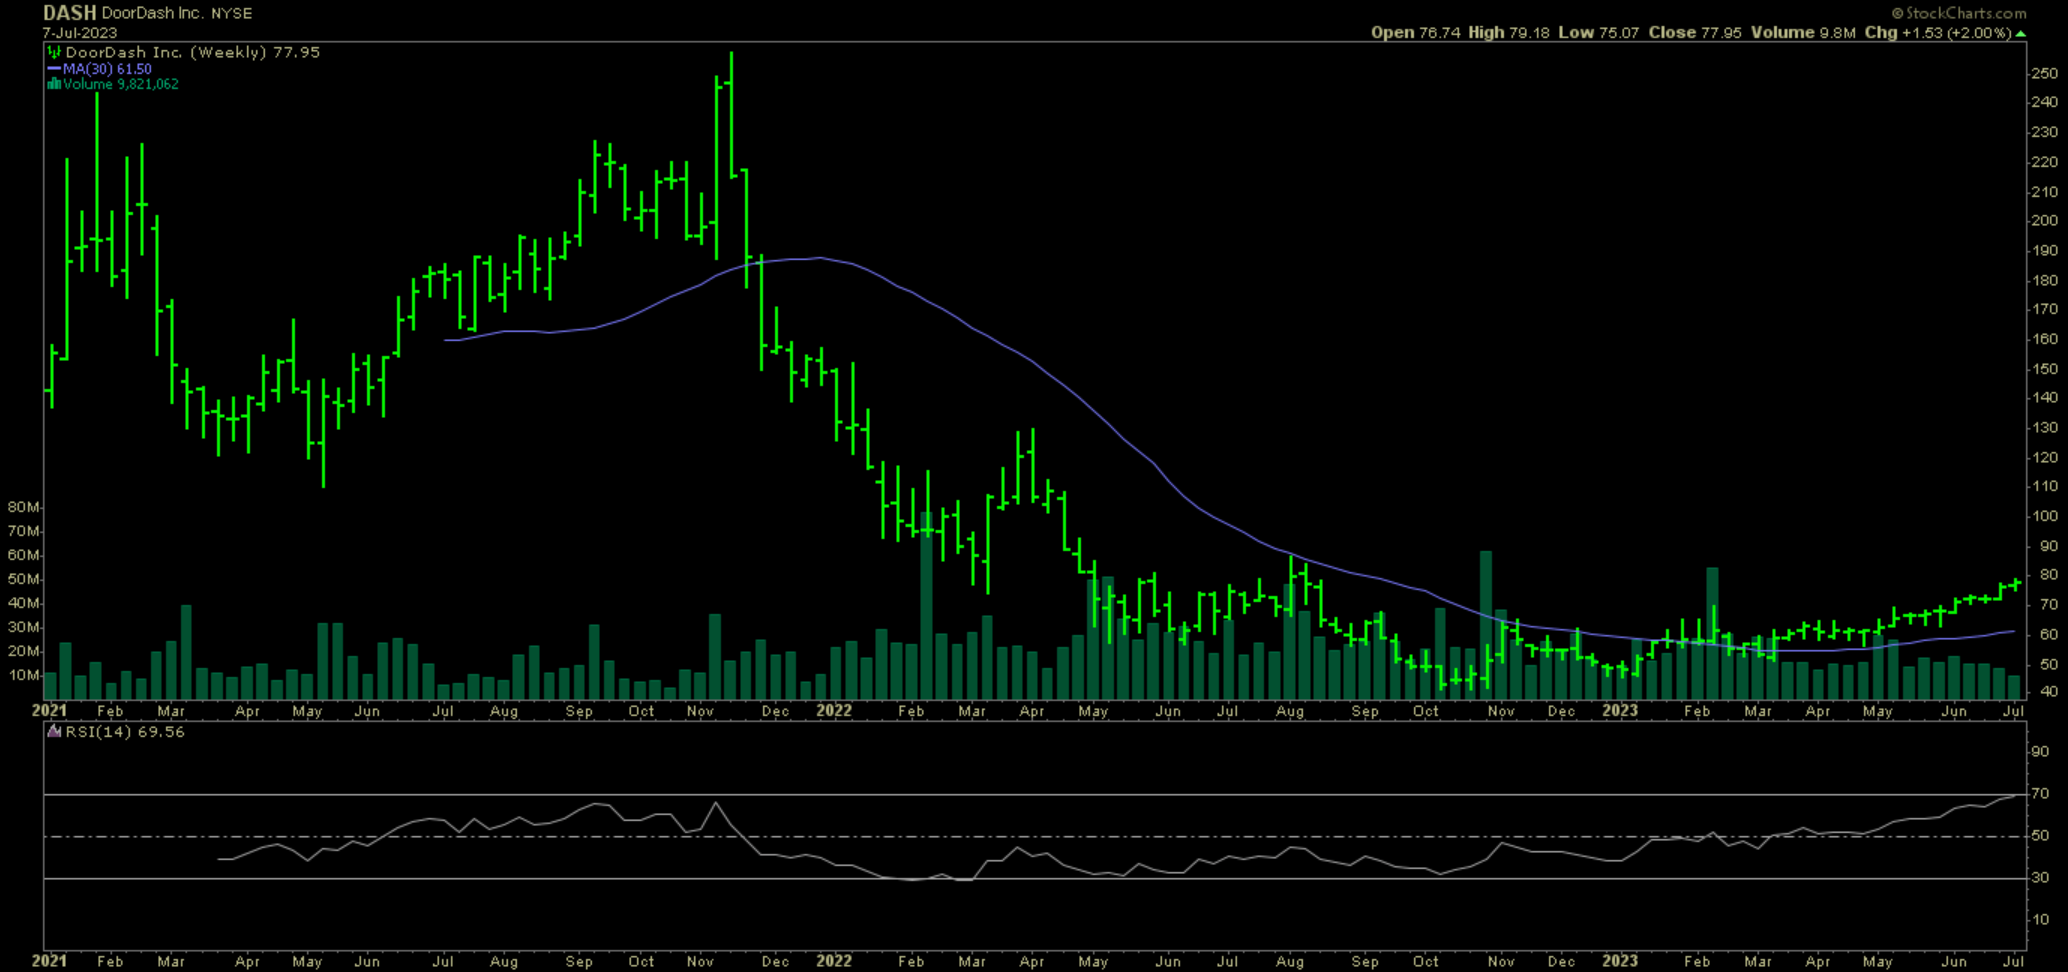
Flying in the face of rotation into value stocks and beaten down internet companies, lastly we take a look at the run DoorDash has been having. With a weekly rsi getting overbought, it’s also worth watching if/when the move stalls out and mean reversion takes hold.
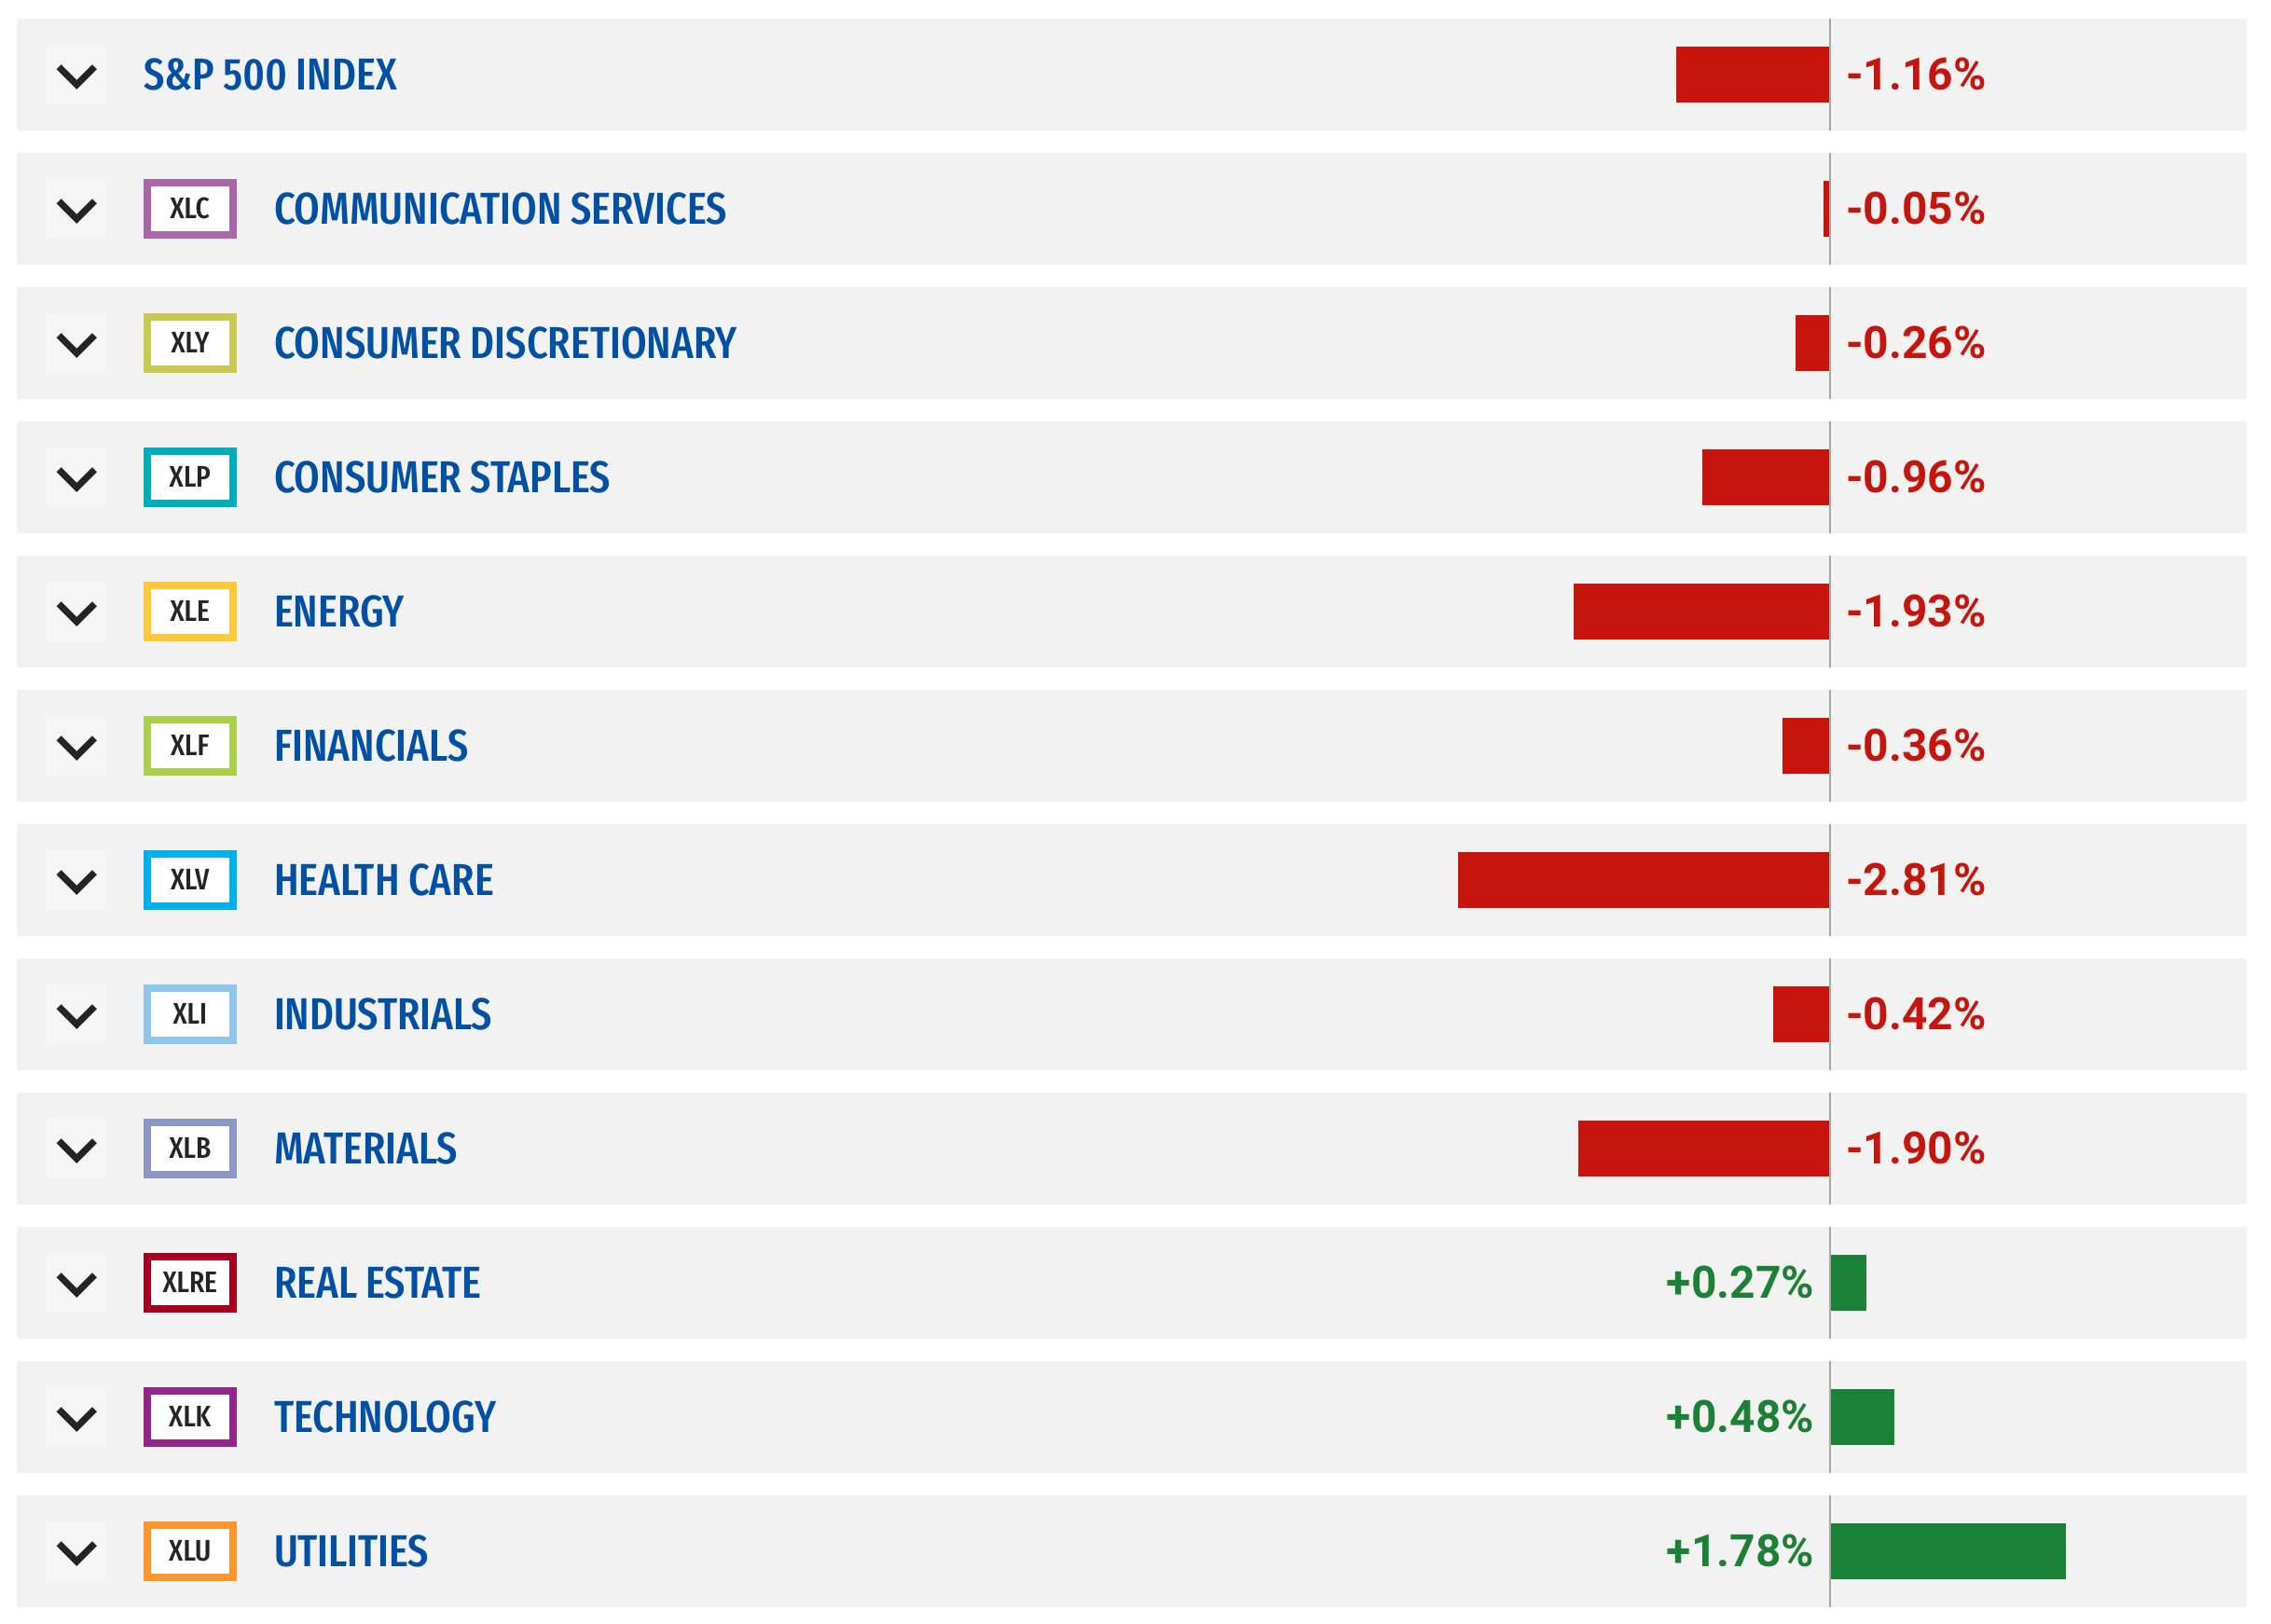
2) Sector Performance
M/E/I (Materials, Energy and Industrials) made the top of the scorecard Friday.
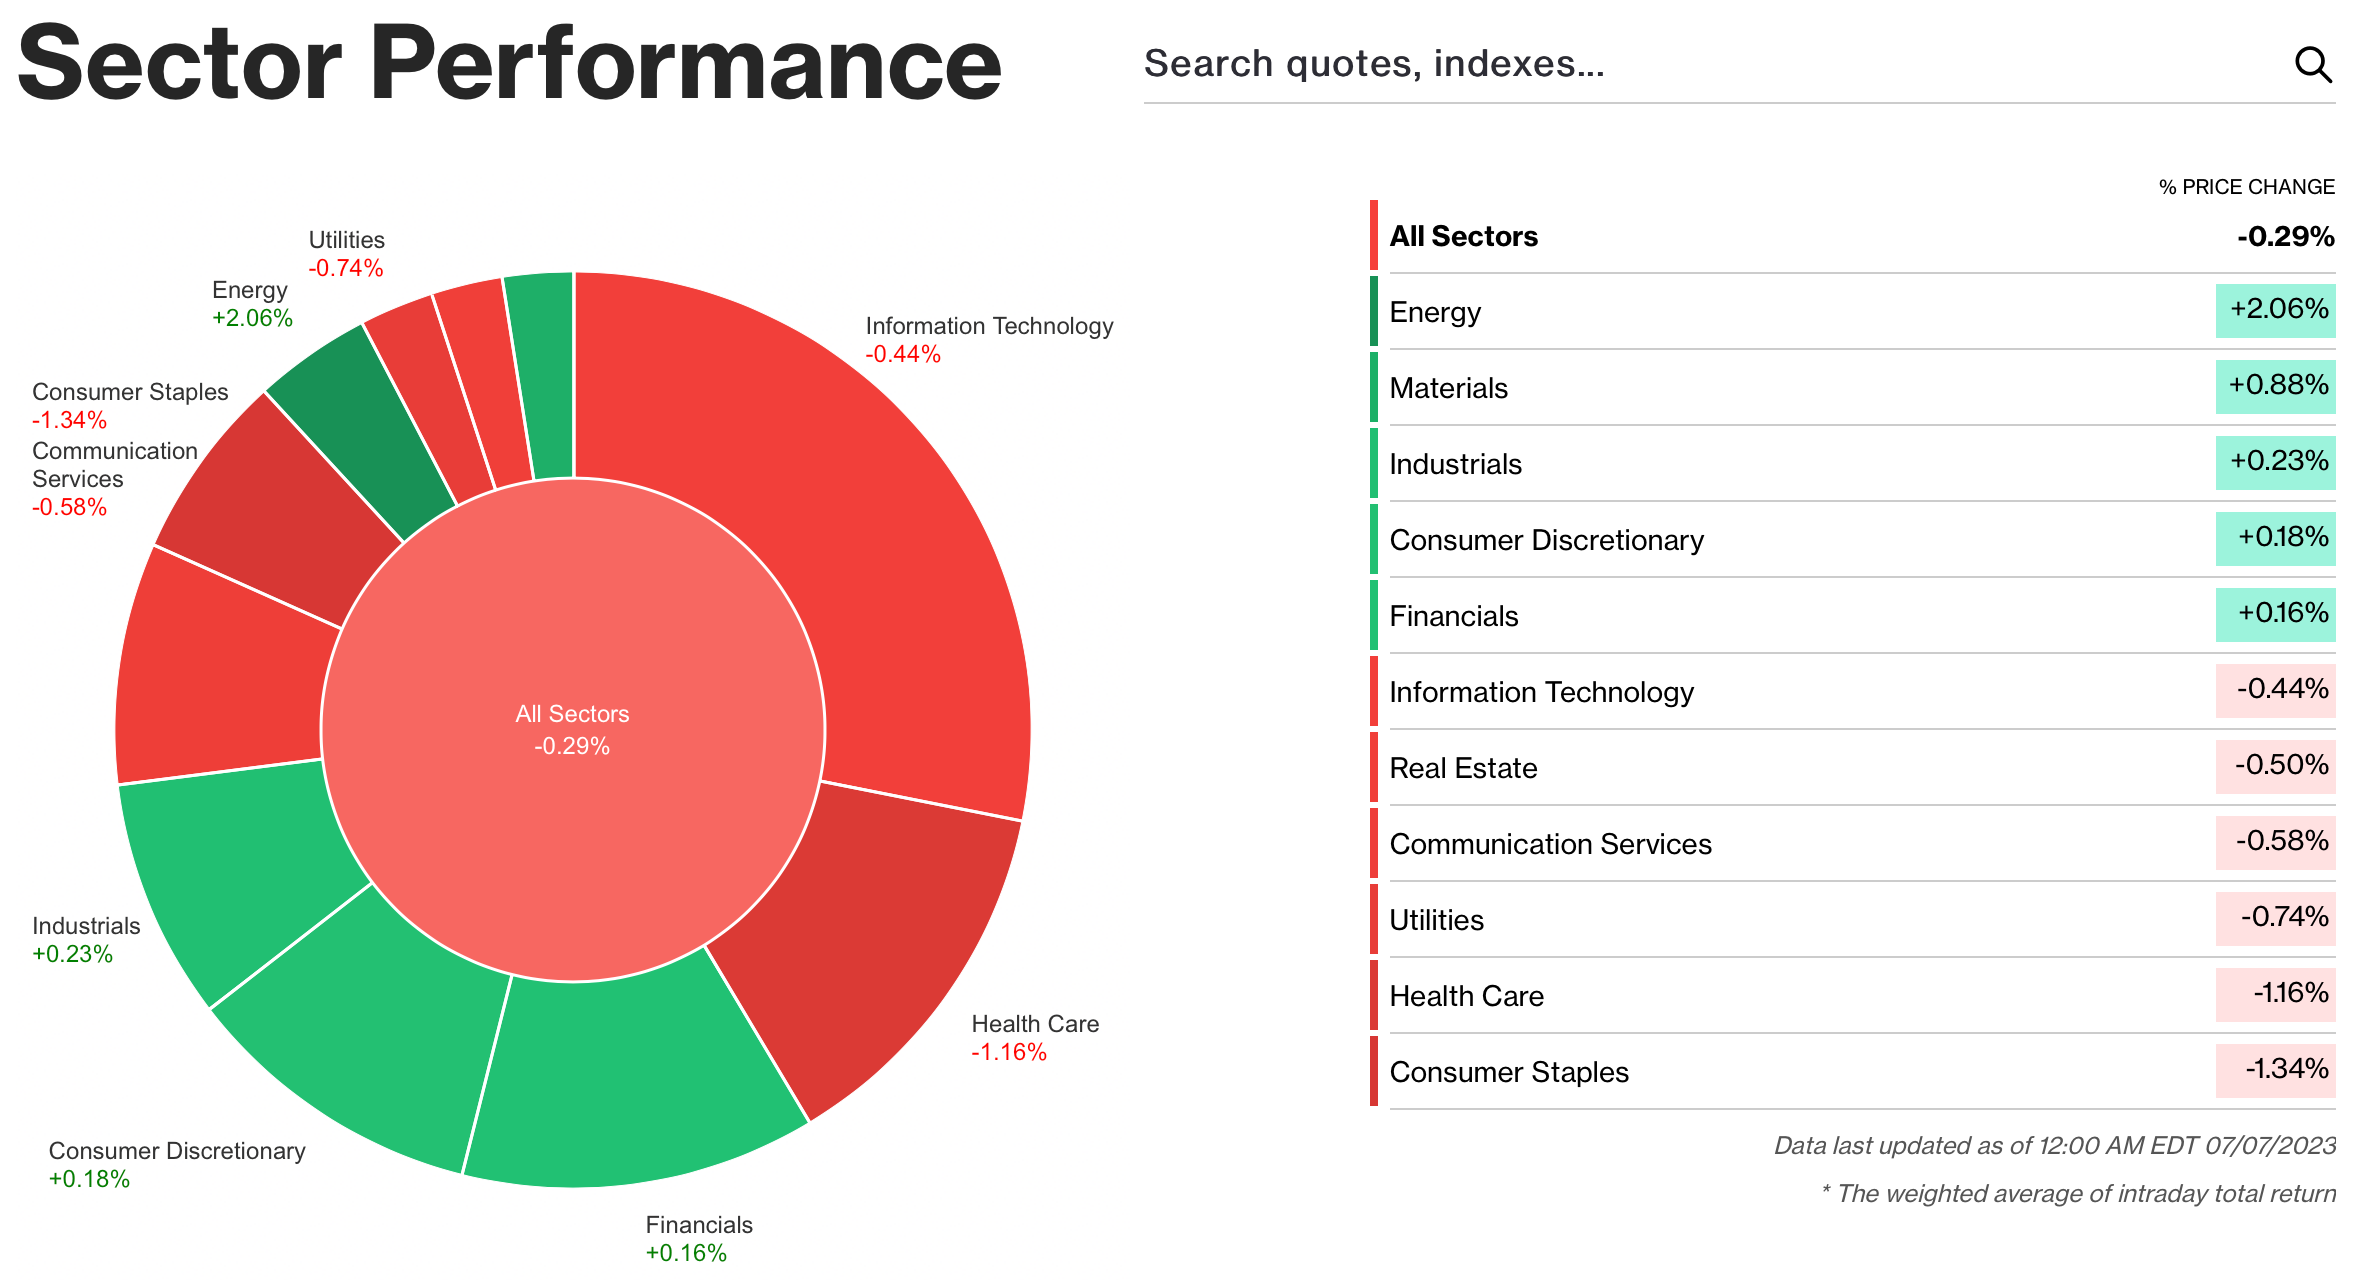
Looking at the week, there were some signs showing up of Risk-Off behavior with S&P500 shedding >1% for the week and Utilities gaining the most. However, we notice investor’s reluctance to part with technology and sector’s like Real Estate continuing their steady healing process since the March dip for all markets.
It’s not so often we bring up the chart of the S&P500, as it is assumed most market participants have it as a part of their morning coffee routine to study it for the pulse of the markets. However bringing in David Keller’s chart from the Mindful Investor, we see clearly distribution at the 4400 level with negative rsi divergence showing up. Now for technicians it was hugely important when we crossed the 62% fibonacci retracement of the all-time highs at 4300, as such moves generally confirm the entrance of a new bull market. In my mind it’s not so important if bulls show up again at 4300, but their are both rising trendlines and moving averages below to be aware of. Therefore, possible tests in the forthcoming weeks and/or months to come bear significant importance.

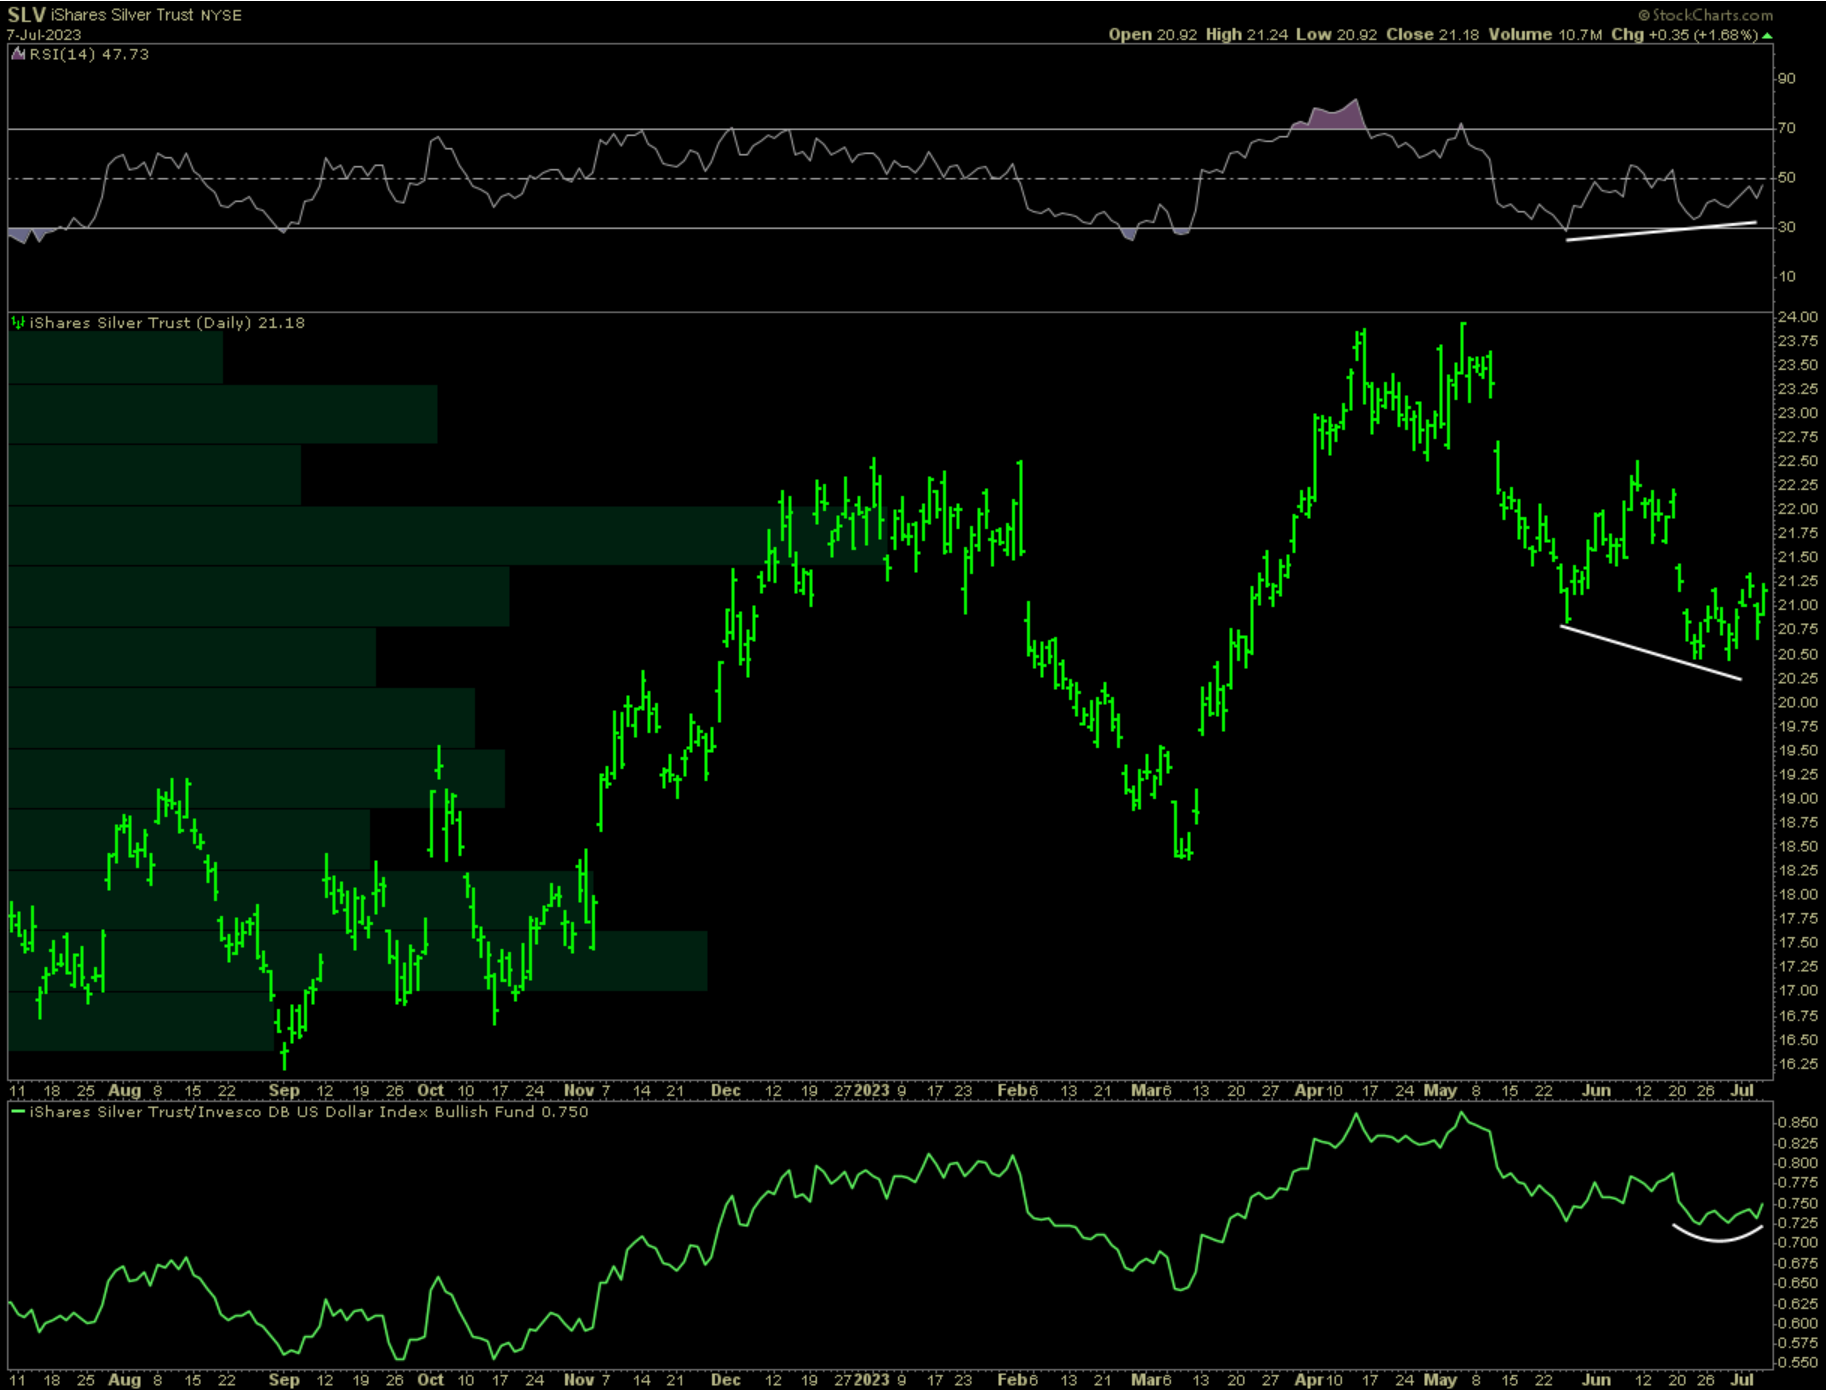
With hard assets like real estate outperforming on the week, and oil basing in the commodities space, there may be some opportunity in precious metals, here taking a look at a possible positive divergence in the chart of SLV 0.00%↑
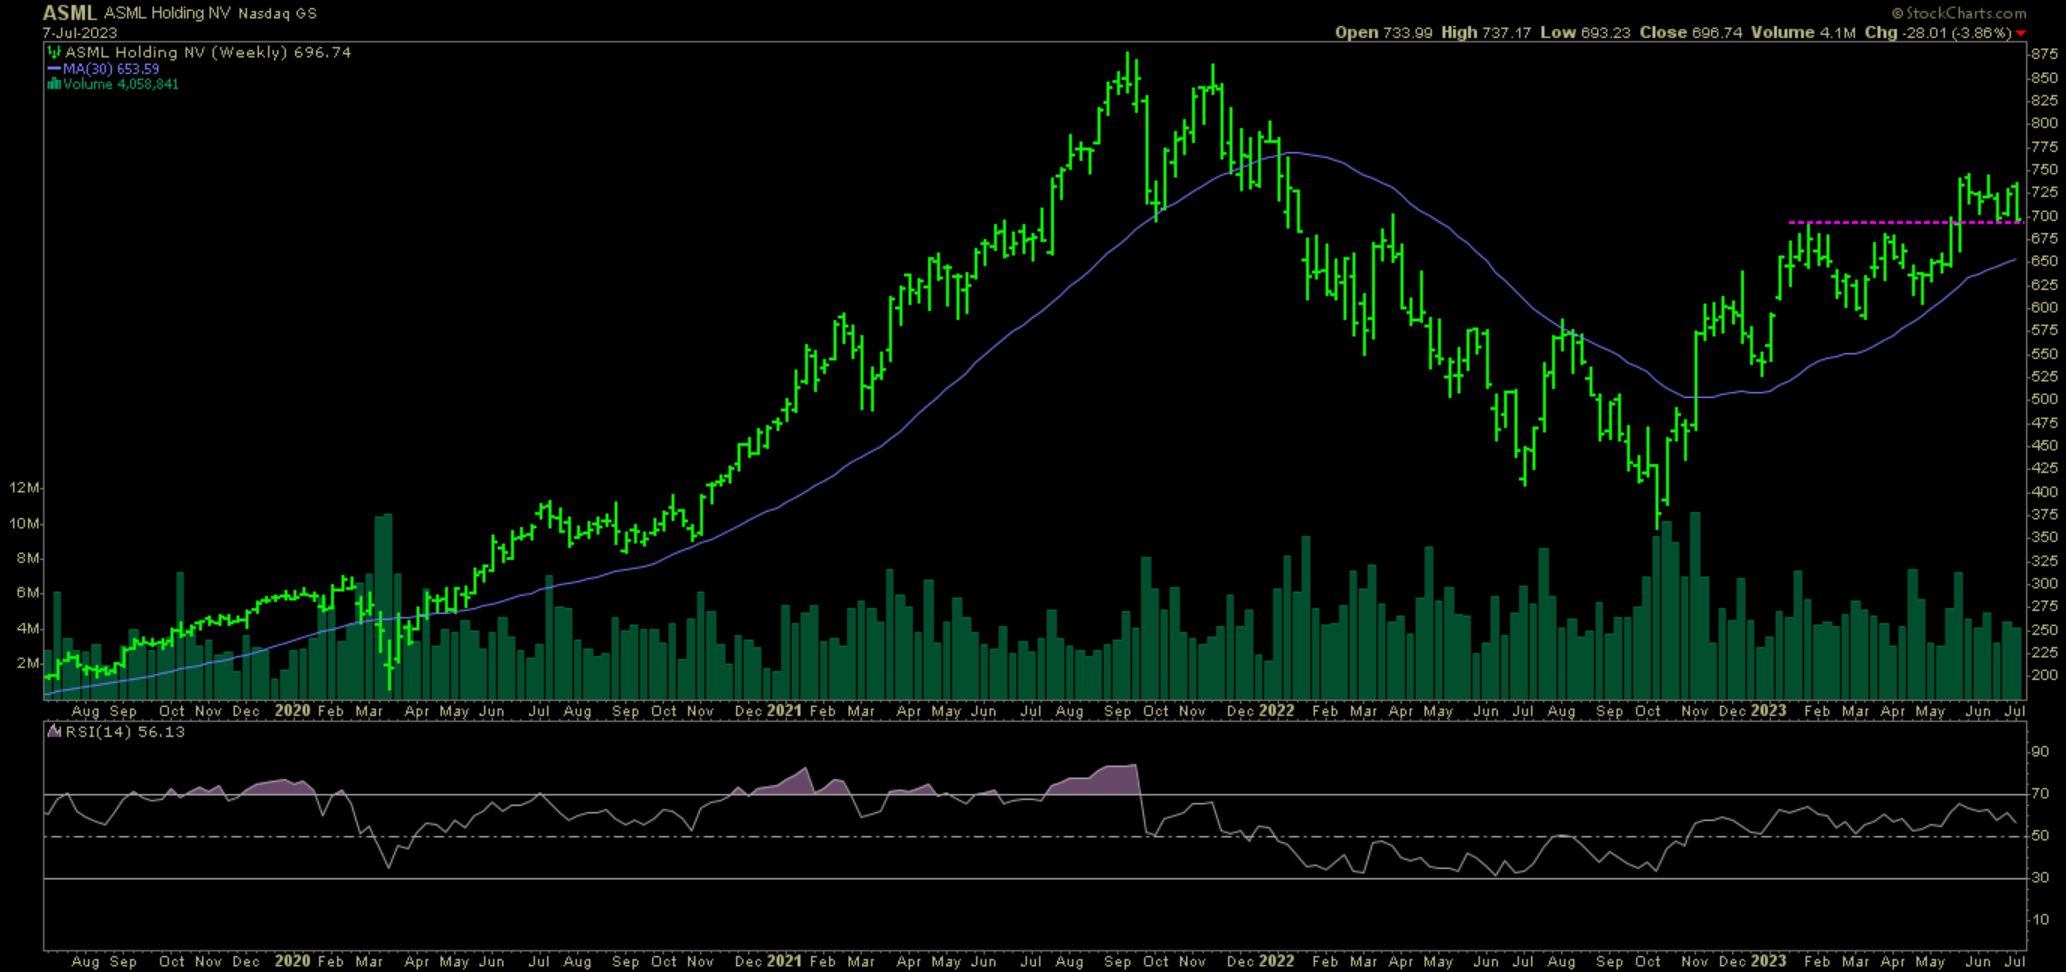
Semiconductors
The SMH still looks to be in a healthy consolidation phase this week, with leaders such as NVDA and TSM gaining. The third horseman ASML 0.00%↑ however was not nearly as strong, possible suffering more from export restrictions to China. Biased by recent events though, this could be either a great buying opportunity or a bellwether of where this may take the broader industry.
3) Earnings reports from this following week:
(*earnings reports will resume next week following results from the large banks)
4) The week ahead
From Barrons:
The Calendar
Second-quarter earnings season begins next week with several large U.S. banks set to report. Also, the latest inflation data will be closely watched by investors and economists alike.
Citigroup, JPMorgan Chase, and Wells Fargo will be next week's earnings highlights, all on Friday morning. Cintas, Conagra Brands, Delta Air Lines, Fastenal, and PepsiCo are also scheduled to report on Thursday. Friday also brings reports from BlackRock, State Street, and UnitedHealth Group.
The economic-data highlight of the week will be the Bureau of Labor Statistics' consumer price index for June on Wednesday. Economists' consensus estimate calls for a 3% increase in the headline CPI from a year earlier, which would be a point less than in May. The core CPI is seen rising 5% year over year, 0.3 percentage point less than a month earlier. Both would be the slowest rates of inflation since 2021. The BLS also releases the producer price index for June on Thursday.
Other data next week include a pair of sentiment indicators. On Tuesday, the National Federation of Independent Business will release its small business optimism Index for June. On Friday, the University of Michigan releases its consumer sentiment index for July.
--Nicholas Jasinski
5) Macro conditions
Weekly risk signals are based on intermediate and long-term market trends, as well as the flow of money into or away from asset classes. Not included are potential fundamental or gamma implied volatility tail risks.
Note: top traders themselves have a hit rate approaching the 50% lower bound. Controlling risk on losing positions and letting winners prosper is for many the difference in creating a successful track record over time.

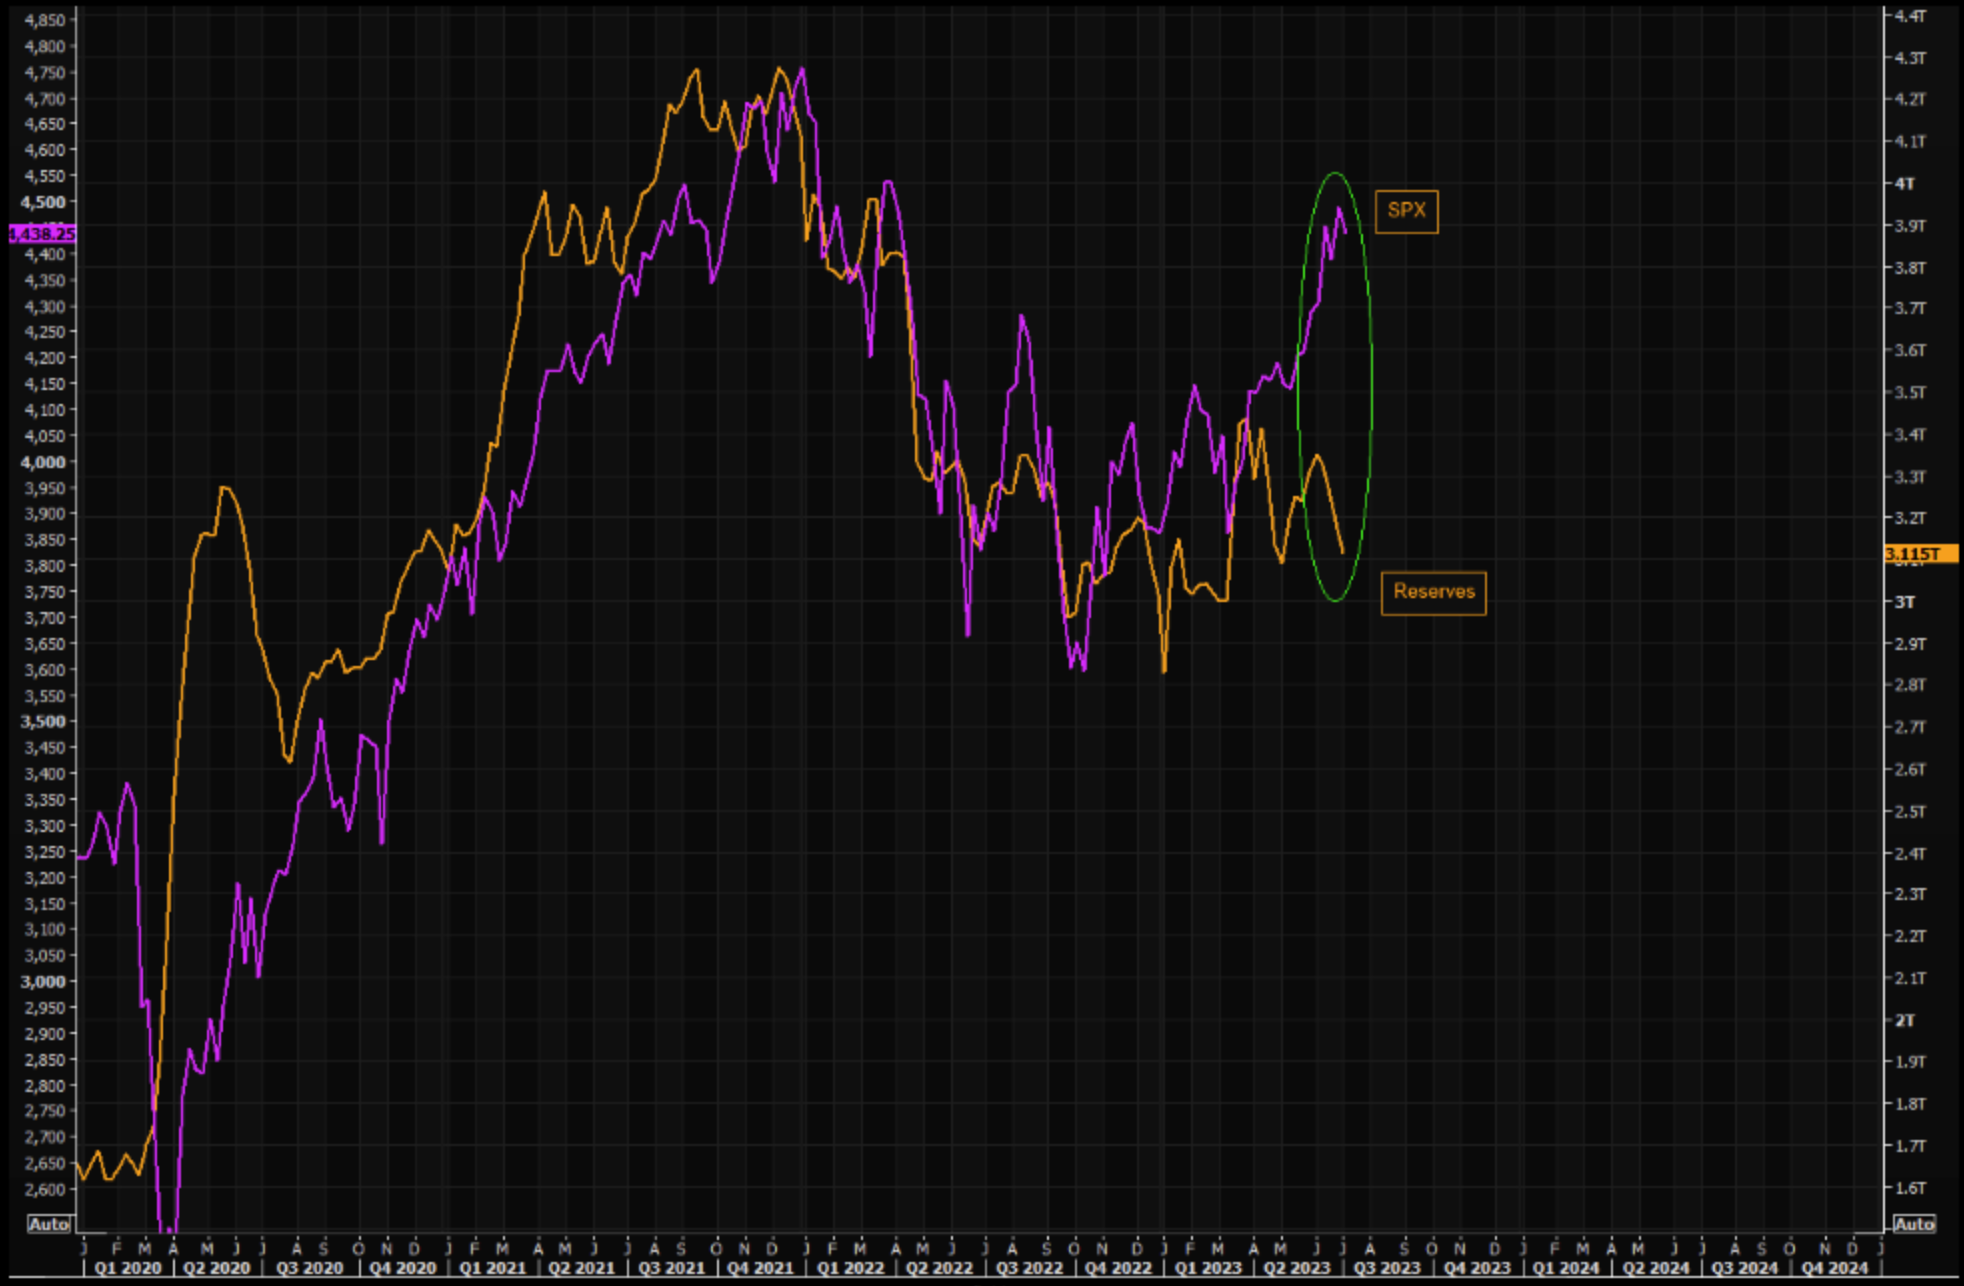
On the macro front this week we saw weakness in the US dollar and long-term US treasuries as measured by TLT 0.00%↑ with reflexively oil prices ticking higher. With broad stock indices already positive on the year, and commodities catching a big this was to keep the trend model pointing up.
Taking a look at the $XLE the cap weighted index of US Oil Producers, we see that the rsi and price made a positive divergence in May, with follow-thru last month and rsi continuously returning to positive territory.

Because of the July 4th holiday there were no inventories data from US energy agencies so we can’t confirm that we want to get bullish on this sector prior to price confirming a breakout. As seen from the chart above, there is a lot of overhead baggage, so we first want to see a break above the downtrending line before we get excited.

In the advent that more late cycle behavior returns due to real interest rates going higher, the weakness we’ve seen recently in bonds might spill over to continued weakness in other areas. Given serious strains caused from Federal Reserve monetary tightening, there were early signs of investors beginning to want safety in owning Japanese Yen. If job strength turns rolls into employment weakness, it be a difficult for lawmakers and the Fed to stop the pendulum before other damage is done.

😎 Cheers! 😎
Disclaimer: Please note that the information provided in this article is for general informational purposes only and does not constitute financial, legal, or professional advice. The information provided should not be relied upon as a substitute for financial, legal, or professional advice. Before making any decision, it is important to consider all relevant information and consult with a professional who can provide personalized advice based on your specific circumstances. The author and publisher of this article cannot be held liable for any actions taken based on the information provided. This is not a recommendation to buy or sell any specific securities or financial instruments.